Figure 3.

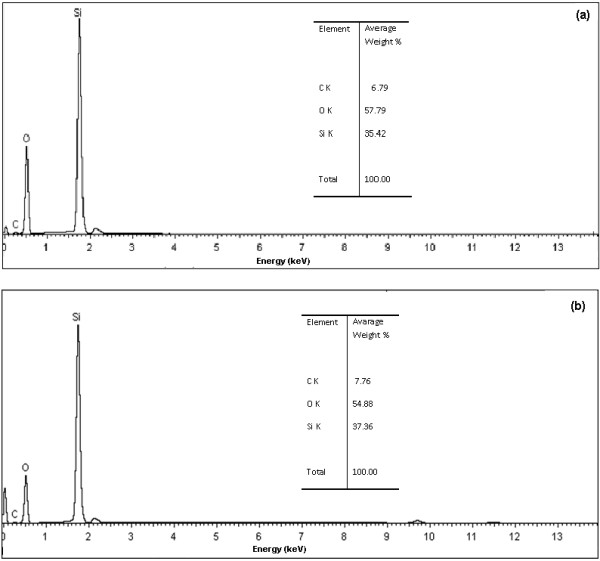
EDS spectrum from the nanocrystalline particles: a) O1 opal and b) O2 opal. The chemical analysis of opal nanoparticles shows a composition of silicon and oxygen, with a few concentration of carbon of unreacted TEOS.

EDS spectrum from the nanocrystalline particles: a) O1 opal and b) O2 opal. The chemical analysis of opal nanoparticles shows a composition of silicon and oxygen, with a few concentration of carbon of unreacted TEOS.