Figure 5.

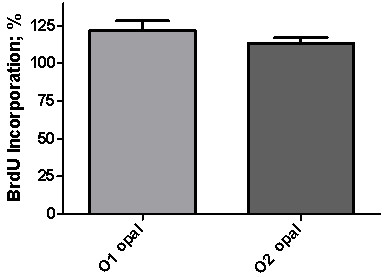
Histogram of BrdU incorporation in 3T3-NIH cells. The percentage of BrdU incorporation into the cells indicates that nanocrystalline opal exposure does not show significant difference between the evaluated particles (P = 0.0931).

Histogram of BrdU incorporation in 3T3-NIH cells. The percentage of BrdU incorporation into the cells indicates that nanocrystalline opal exposure does not show significant difference between the evaluated particles (P = 0.0931).