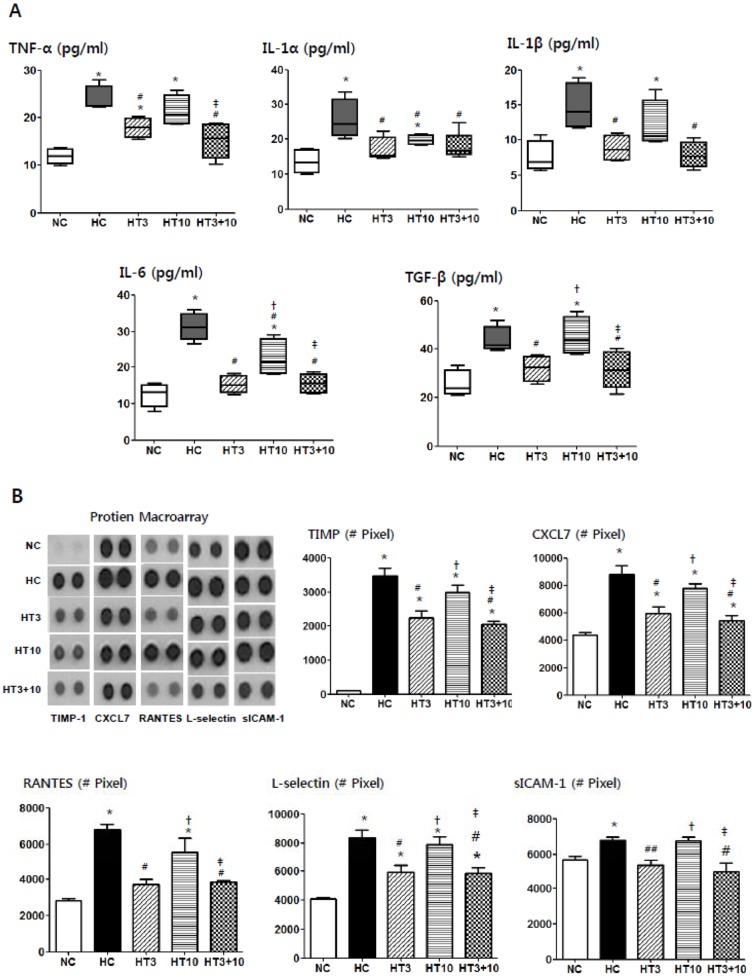
Figure 7. Histograms of inflammatory cytokines and chemokines in the hyperoxic lung injury after MSCs transplantation.
TNF-α, IL-1α, IL-1β, IL-6, and TGF-β levels measured by ELISA (A) and TIMP-1, CXCL7, RANTES, L-selectin and sICAM-1 levels measured by protein array at P21 in the rat lung tissue (B,C). NC, Normoxia control group; HC, hyperoxia control group; HT3, hyperoxia with stem cell transplantation group at P3; HT10, hyperoxia with stem cell treatment group at P10; HT3+10, hyperoxia with stem cell treatment group at P3 and P10. Data; mean±SEM. * P<0.05 compared to NC, # P<0.05 compared to HC,† P<0.05 compared to HT3, ‡ P<0.05 compared to HT10.

