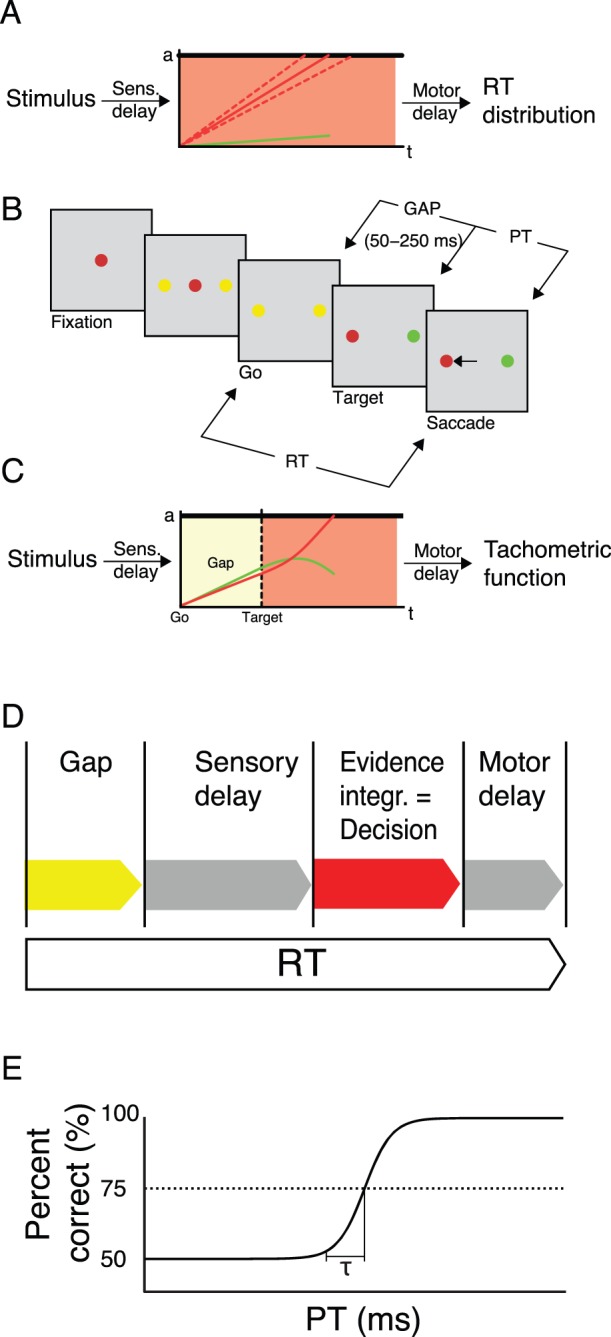
Figure 1. Rapid decision making and compelled responses.

A. Race-to-threshold model. Evidence for each stimulus alternative is accumulated until a threshold a is crossed (solid red and green lines for either of the two stimulus alternatives, respectively). The evidence for the stimulus alternative that crosses the threshold first determines the decision (here, red). Reaction times vary because the accumulated evidence varies across trials due to noise (dashed lines). B. Compelled response paradigm [20]. A red or green central fixation dot is presented. Then, two peripheral yellow dots appear. The response period starts when the central fixation dot disappears (“GO”). After a variable “GAP” of 50–250 ms duration, one of the dots turns red and the other green. In order to receive reward, macaque monkeys had to execute a saccade to the dot which matched the color of the fixation dot within 600 ms after the GO signal. The difference between the reaction time (RT) and the gap duration (GAP) is the processing time (PT), i.e., the duration for which stimulus evidence is available for decision making. C. Accelerated race-to-threshold model according to Stanford et al.
[20]. During the GAP period, noise drives the decision process for both stimulus alternatives. If gap durations are long, the noise drives evidence across the threshold leading to a “guess” decision (not shown). If gap durations are short, the evidence for the correct answer quickly increases (red line) rapidly leading to a decision, while the evidence for the other alternative decreases (green line). D. Total reaction times (RT) in the compelled-response paradigm consist of the gap duration, the constant sensory and motor delays and the actual decision making time which is identical to the time of evidence integration. In classical decision making experiments, no gap is presented. E. In the compelled- response paradigm, the decision making time can be derived from the tachometric function. The tachometric function plots performance (percent correct) as a function of processing time  , i.e., the duration stimulus evidence is available for decision making. The non-decisional time (sensory and motor delay) is thought to be reflected in the flat part of the tachometric function where performance is around 50%. The rise time
  from chance level 50% performance to the 75% correct responses threshold (dashed line) is a measure for evidence accumulation. Stanford et al. (2010) estimated this time to be about 30 ms [20].
