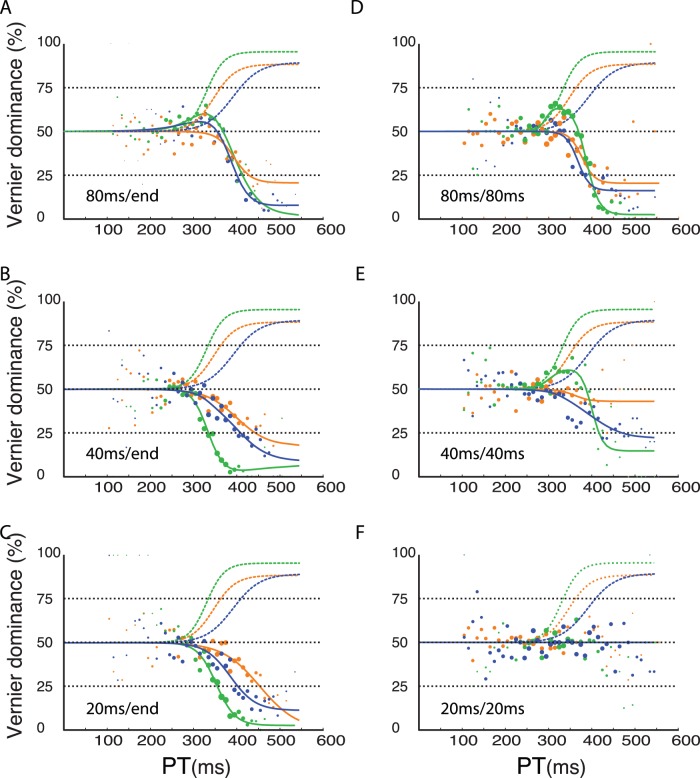
Figure 4. Results of compelled two-vernier stimulus response paradigm.
The first vernier was presented either for 80 ms (A, D), 40 ms (B,E) or 20 ms (C, F). The second vernier was presented either until the end (“end”) of the response period (A, B, C) or for the same duration as the first vernier (D, E, F). Dashed curves are re-plotted from Fig. 2B and denote performance in the vernier only condition and are identical in all six plots. Solid lines indicate performance in the two-vernier conditions. When the second vernier was presented until the end of the response period, the second vernier clearly dominated performance (A–C; A is the same as Fig. 3B). Performance is very similar in all three conditions. When the second vernier was presented for the same duration as the first one, dominance of the second vernier decreased when durations of both verniers decreased (D–F). When the first and second vernier are presented for 20 ms each, dominance remains at about the 50% level for all subjects (F), i.e., both verniers cancel each other out. The tachometric function is flat (all three lines are on top of each other and only the blue line is visible). Except for one observer (green line), there is no evidence that evidence for the first vernier escapes integration with the second vernier. For this observer, it seems that in the 80/80 ms and 40/40 ms, the first vernier dominates for short gap durations.

