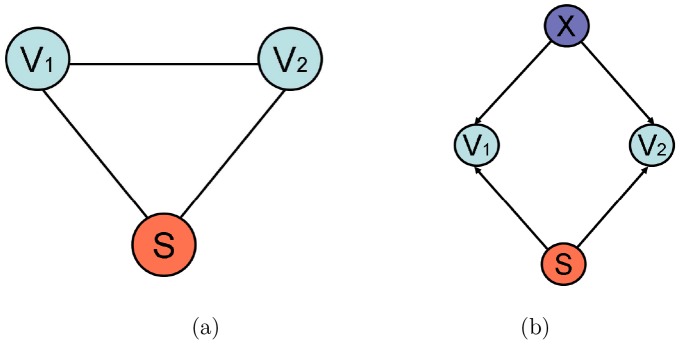
Figure 1. Graphical models of voxel interactions.

Simple probabilistic graphical models capturing interactions among voxel-level BOLD signals and observed stimulus: (a) Markov network (undirected graph) over a pair of voxels and the task; (b) Bayesian network (directed graph) that includes an unobserved variable capturing other brain processes, besides the response to the observed stimulus, that can affect the BOLD signals. Note that directed links in Baysian networks are often (though not always) used to depict potential causal dependencies among the variables.
