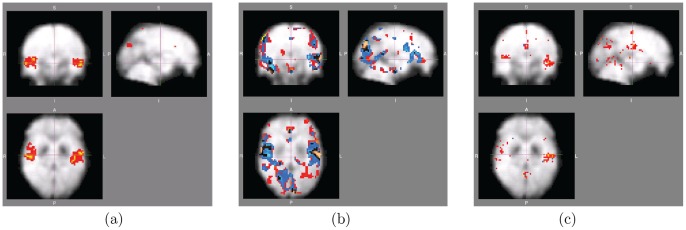
Figure 5. Two-sample t-test results for different features: voxels surviving FDR correction.
(a) Normalized degree maps; (b) strength (red-yellow), absolute strength (blue-light blue) and positive strength (black-white); (c) clustering coefficient and local efficiency maps. Here the null hypothesis at each voxel assumes no difference between the schizophrenic vs normal groups. Colored areas denotes low p-values passing FDR correction at  level (i.e., 5% false-positive rate). Note that the mean (normalized) degree at highlighted voxels was always (significantly) higher for normals than for schizophrenics. Coordinates of the center of the image: (a) and (c) X = 26,Y = 30,Z = 16, (b) X = 26,Y = 30,Z = 18.xl.

