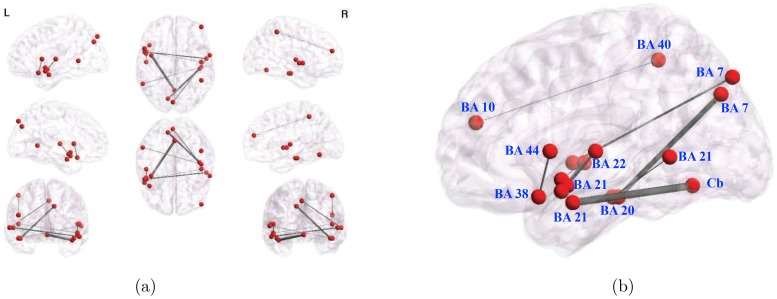
Figure 7. 9 stable edges common to all subsets of 30 top-ranked (lowest-pvalue) edges that survived Bonferroni correction, over 22 different cross-validation folds (leave-subject-out data subsets).
(a) All views and (b) enlarged saggital view. Edge density is proportional to their absolute value. The network includes several areas not picked up by the degree maps, i.e. other than BA 22 and BA 21, mainly the cerebellum (declive) and the occipital cortex (BA 19).

