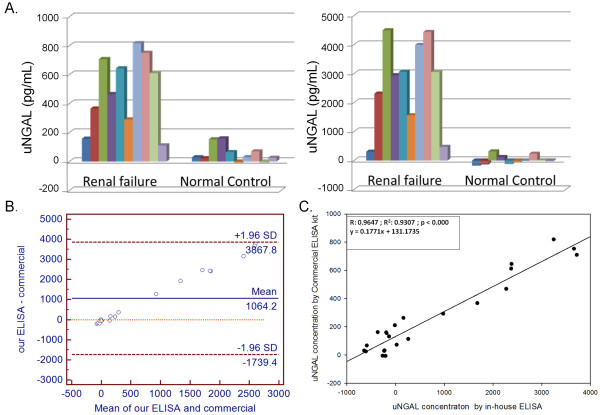
Figure 3.

A comparison of the results obtained by a commercial ELISA kit and by our NGAL ELISA. (A) The urine NGAL(uNGAL) concentrations of twenty urine samples collected from 10 healthy and 10 renal failure dogs measured by Commercial ELISA kit (left panel) and by our ELISA (right panel). (B) Bland-Altman plot of uNGAL concentrations from 20 urine samples measured by the two methods. (C) Linear regression analysis and coefficient of correlation analysis (Software SigmaPlot 10.0) were conducted to correlate the results of these two ELISA systems. Each column represents the μNGAL concentration of a dog.
