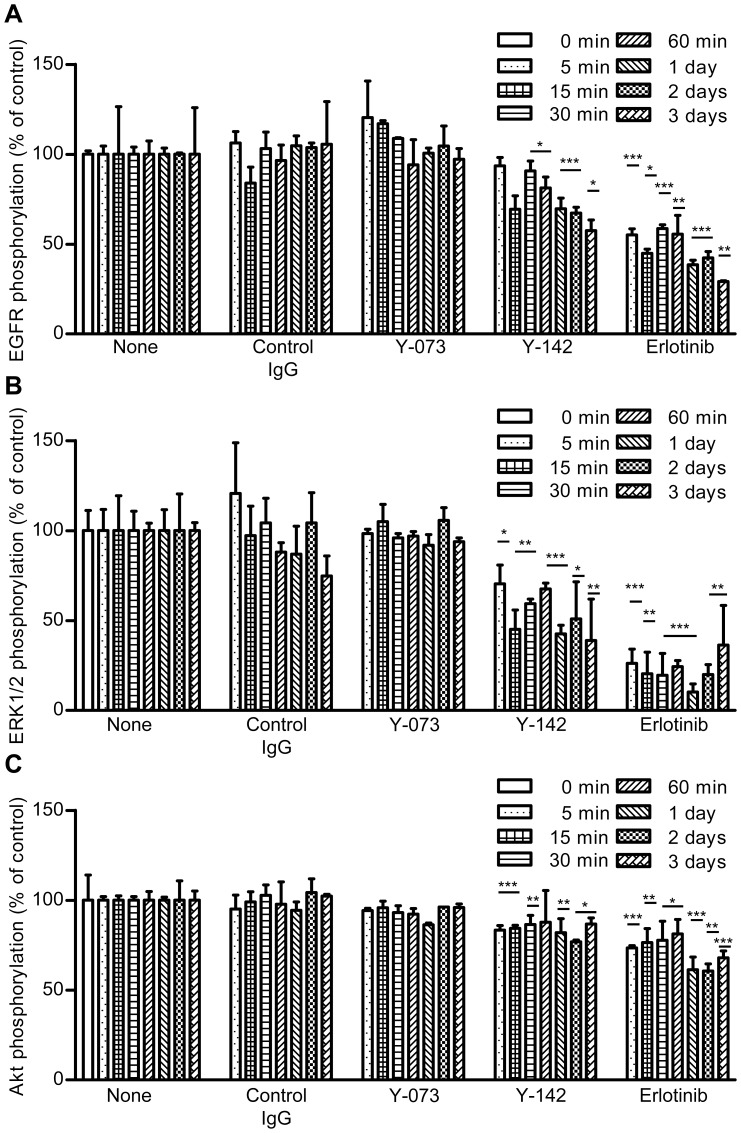
Figure 5. Inhibition of proHB-EGF juxtacrine activity by Y-142.
proHB-EGF juxtacrine activity was measured using Y-142. NUGC-3 cells in a spheroid culture plate were treated with 200 nM control IgG, 200 nM Y-142, 200 nM Y-073, or 1 nM erlotinib for the indicated times. A. Phosphorylation of EGFR. B. Phosphorylation of ERK1/2. C. Phosphorylation of AKT. Phosphorylation was calculated as the percentage of the phosphorylation of PBS-treated cells. The data points represent the mean ± SD of values acquired in triplicate. Statistical analysis was performed using the unpaired t-test (one-tailed, vs. PBS-treated sample at the corresponding time point). *, p<0.05; **, p<0.005; ***, p<0.0005.

