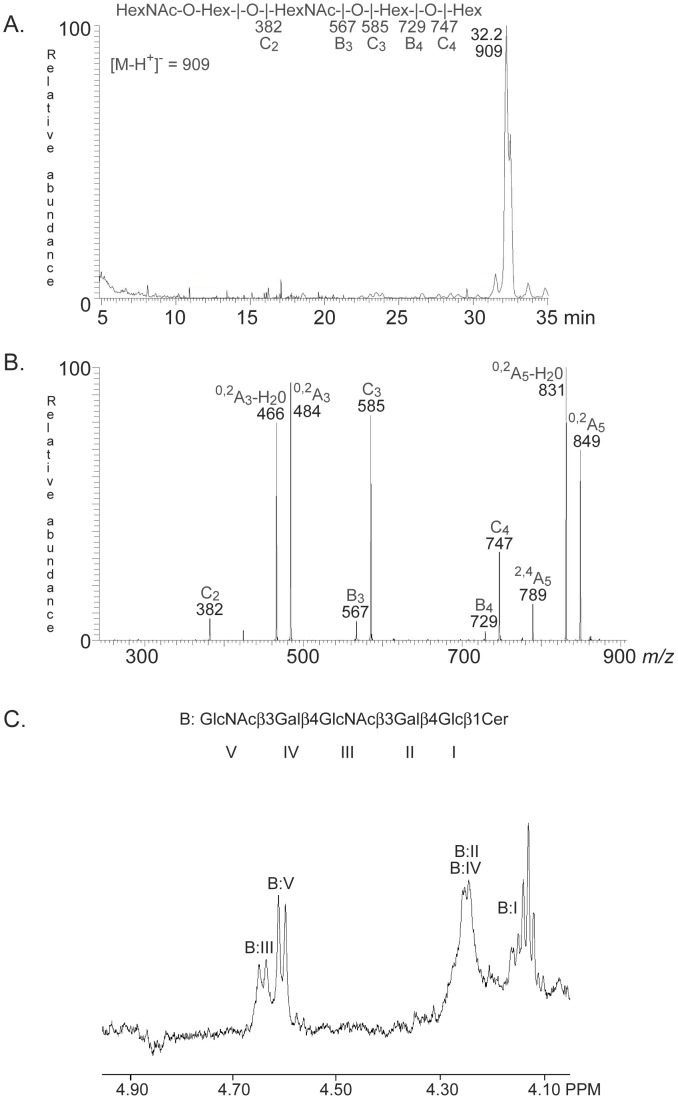
Figure 4. Characterization of El Tor binding fraction TH-I from rabbit thymus.
(A) Base peak chromatogram from LC-ESI/MS of the oligosaccharide obtained by digestion of fraction TH-I with endoglycoceramidase II. (B) MS2 spectrum of the [M-H+]− ion at m/z 909 (retention time 32.2 min). (C) Anomeric region of the 600 MHz 1H NMR spectrum of fraction TH-I (30°C). The designation B refer to Table 1.

