
Figure 2. Localization of fluorescently labeled PAF peptides in N. crassa cells.
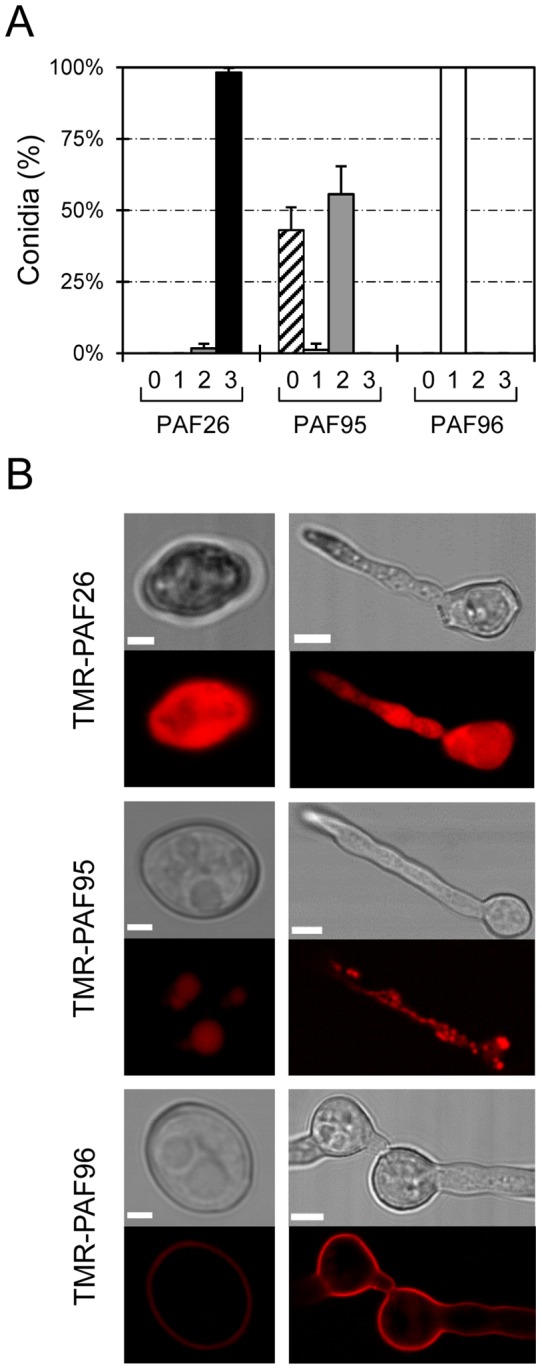
(A) Percentage of conidial population that do not show any TMR-peptide fluorescence signal (class “0”, striped bars), or show TMR-peptide fluorescence limited to cell envelopes (class 1, white bars), intracellular organelles (class 2, light grey bars), or filling the whole cytoplasm of the cells (class 3, black bars), after 1 h of treatment with 5 µM of each of the TMR-peptides. (B) Representative confocal images showing the localization of TMR-PAF26, TMR-PAF95 and TMR-PAF96 (in red) in conidia (left panels) and conidial germlings (right panels). For each peptide, the most common pattern of localization is shown (see A). Bars: 2 µm in conidia and 5 µm in germlings.