
Figure 7. Differential localization of TMR-PAF26 in different S. cerevisiae strains.
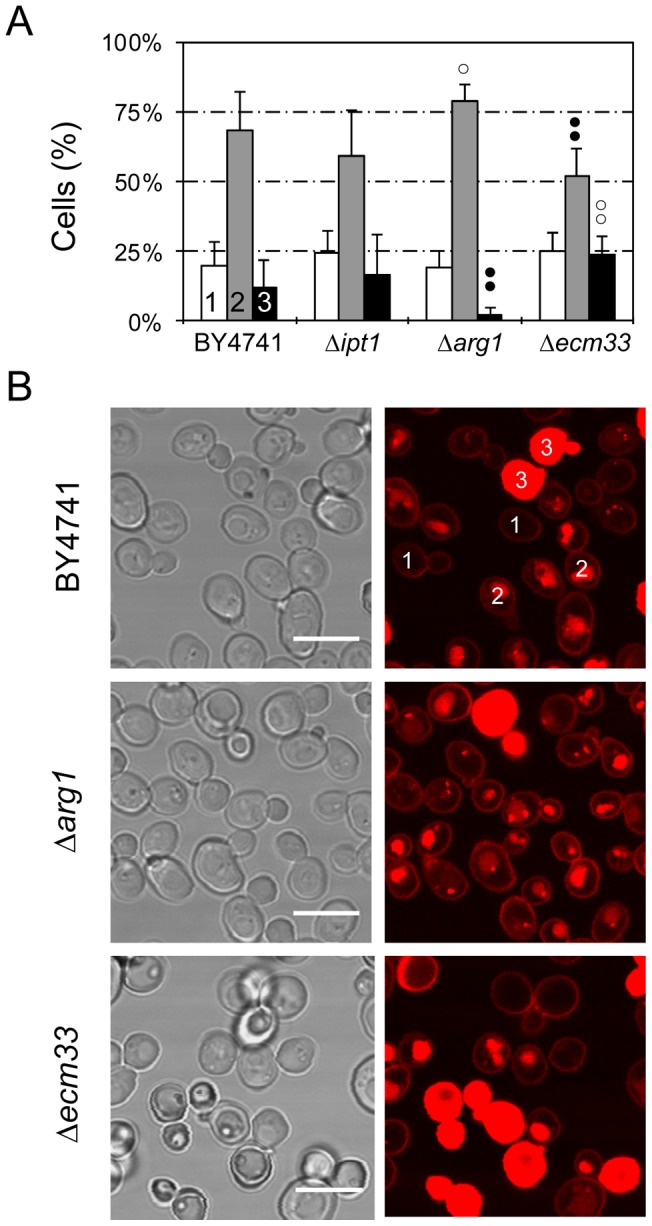
(A) Graph showing the percentage of cells that show TMR-PAF26 fluorescence limited to the cell envelope (class 1, white bars), in intracellular organelles (class 2, light grey bars), or filling whole cells (class 3, black bars), after treatment for 1 h with the peptide for each strain (as labeled on the x-axis). Cell location was determined by confocal microscopy. Results represent the means ± standard deviations of three experiments, each performed in triplicate. Dots above bars indicate statistical significance as compared to each class in the BY4741 parental strain control. Black dots indicate percentage lower than BY4741 and white dots higher. Two dots indicate p<0.01, and one dot p<0.05. (B) Representative confocal microscopy images are shown from the data set quantified in (A). Two examples of classes 1, 2 and 3 are labelled in strain BY4741. Bar: 10 µm.