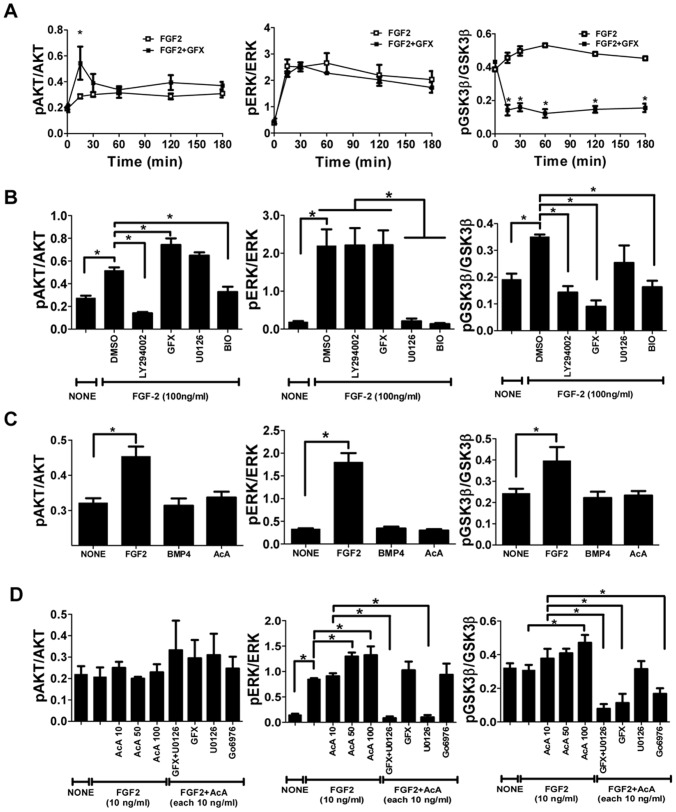
Figure 2. Effect of PKC inhibitor on FGF-2 signaling in hPS cells.
The phosphorylation levels in H9 hES cells were measured by AlphaScreen® SureFire® assay kit. The values of the y-axis are the ratio of each phosphorylation to each total signal protein. (A) The cells were stimulated with FGF-2 (100 ng/ml) in fresh medium without insulin after overnight starvation and incubated with (open square) or without GFX (5 µM, closed square) for 180 minutes. The data are represented as means ± SE (n = 3). *P<0.05. (B) The cells were stimulated with FGF-2 (100 ng/ml) in fresh medium without insulin after overnight starvation. Fifteen minutes after FGF-2 addition together with each inhibitor as indicated on the panel. The data are represented as means ± SE (n = 3). *P<0.05. (C) The cells were treated with FGF-2 (100 ng/ml), BMP-4 (100 ng/ml) or activin A (100 ng/ml) in fresh medium without insulin after overnight starvation. Fifteen minutes after the addition of each growth factor as indicated on the panel. The data are represented as means ± SE (n = 3). *P<0.05. (D) The cells after growth factor starvation were stimulated with FGF-2 (10 ng/ml) and activin A (10 or 100 ng/ml) together with U0126 (5 µM) and GFX (5 µM) or Gö6976 (5 µM) in fresh medium without insulin for 15 minutes. Fifteen minutes after the addition of each growth factor/inhibitor as indicated on the panel. The data are represented as means ± SE (n = 3). *P<0.05.

