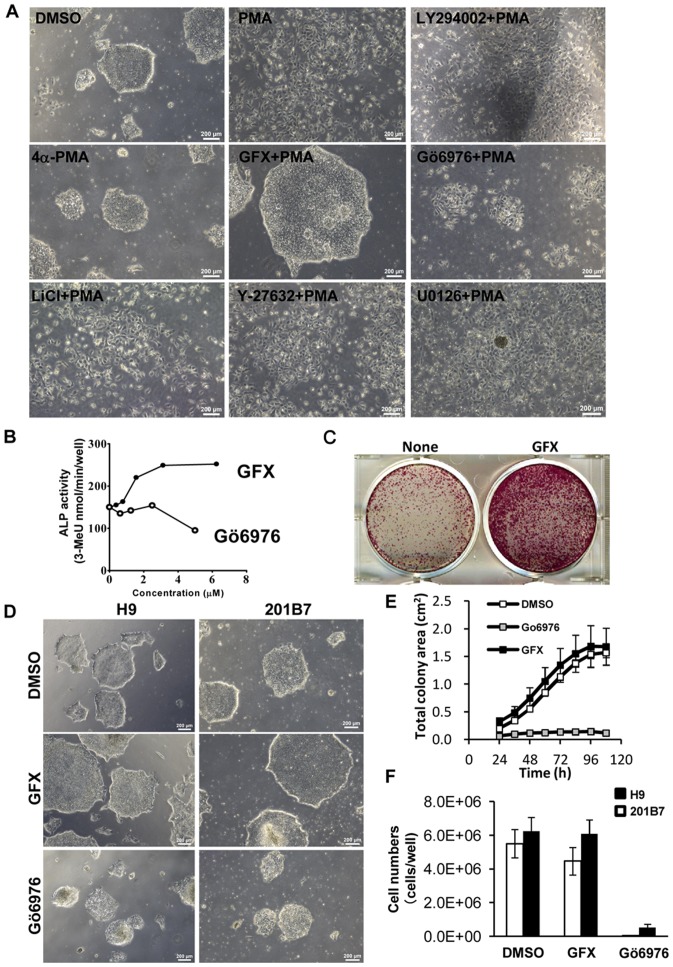
Figure 3. The effect of PKC on the morphologies of hPS cells with or without GFX.
(A) Phase-contrast image of 201B7 hiPS cells cultured in feeder-free hESF9 defined medium on FN 24 hours after treatment with DMSO, PMA (10 nM), 4α-PMA (10 nM), GFX (5 µM), PMA (10 nM) with GFX (5 µM), PMA (10 nM) with Gö6976 (5 µM), PMA (10 nM) with LY-294002 (50 µM), PMA (10 nM) with LiCl (1 mM), PMA (10 nM) with Y-27632 (10 µM), or PMA (10 nM) with U0126 (20 µM). An inactive PMA analogue, 4α-PMA is used as negative control. Scale bars, 200 µm. (B) Quantitative ALP-based assay of 201B7 hiPS cells cultured in feeder-free hESF9 medium with GFX (closed circle) or Gö6976 (open circle) as indicated concentrations. (C) Colony forming efficiency of dissociated single hPS cells cultured with or without GFX. Dissociated single 201B7 cells seeded at 250,000 cells/well were grown on a 6-well plate coated with FN (2 µg/cm2) in hESF9 medium supplemented with and without 1 µM GFX. A in 5 days and stained with ALP fast-red substrate. (D) Phase-contrast image of 201B7 hiPS cells or H9 hES cells cultured in feeder-free hESF9 medium with DMSO (open square), GFX (5 µM, gray square), or Gö6976 (5 µM, closed square). (E) Growth of cell colony area of hPS cells in the presence of GFX or Gö6976. The whole images of 201B7 cell colonies grown in a 6-well-plate coated with FN in the presence of DMSO, GFX or Gö6976 in hESF9 medium was measured by an analysis software, Cell-Quant. The images were captured every 12 hours in live cell imaging system Biostation CT. The data are represented as means ± SD (n = 3). (F) Cell growth of hPS cells in the presence of GFX or Gö6976. The numbers of H9 (open bars) and 201B7 cells (closed bars) grown in a 6-well-plate coated with FN in the presence of DMSO, GFX or Gö6976 in hESF9 medium were counted on 5 days. The data are represented as means ± SD (n = 3).

