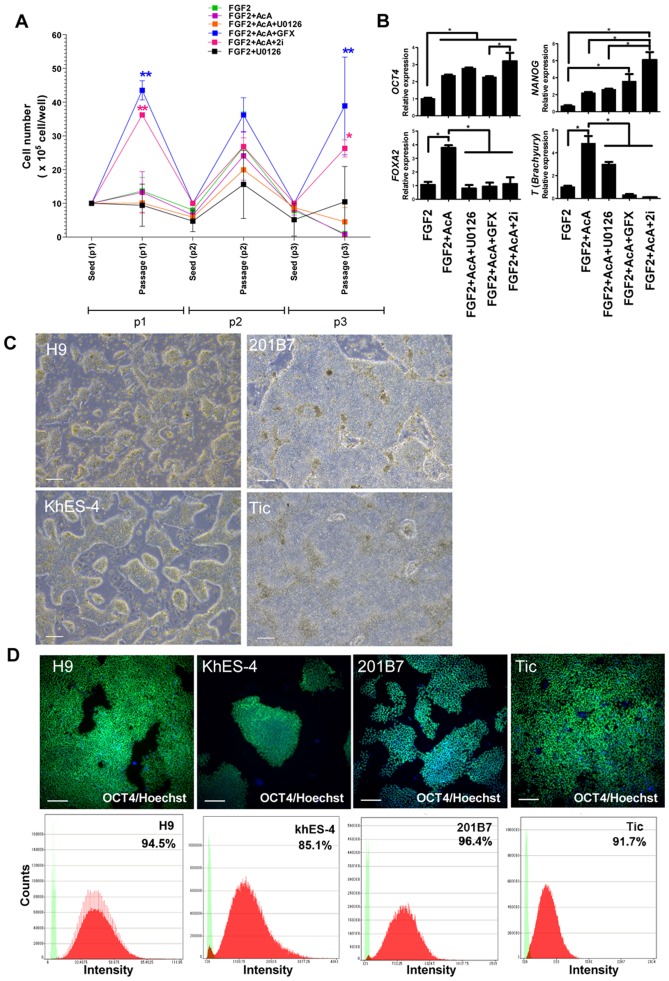
Figure 5. Single cell culture of hPS cells in the hESF9a2i medium.
(A) Cell growth of dissociated single H9 hES cells cultured in each indicated condition for three passages. Cells were reseeded at the cell density of 1×10⁶ cells/well every 5 days. When the cells were passages, cell numbers were counted. Cell growth in the hESF9a2i medium was significantly different (P<0.05) from hESF9 (FGF-2), FGF-2 + activin A, FGF-2 + activin A + U0126. Cell growth in hESF9a + GFX was significantly different (P<0.05) from hESF9 (FGF-2), FGF-2 + activin A, FGF-2 + activin A + U0126, and FGF2 + U0126. The data are represented as means ± SE (n = 3). (B) Gene expression in the hPS cells cultured in each indicated condition for three passages. The gene expression levels of NANOG, OCT3/4, FOXA2, T in the cells were measured by real-time RT-PCR. On the y axis, the gene expression level in the cells cultured with FGF-2 in a experiment was taken as 1.0. The data are represented as means ± SE (n = 3). *P<0.05. (C) Phase-contrast image of hPS cells grown on FN in hESF9a2i medium for 3 passages. The cells were dissociated into single cells for passage, and reseeded at a ratio of 1∶3 - 1∶5 every five days. Scale bars, 200 µm. (D) OCT3/4 expression in hPS cells grown on FN in hESF9a2i. The cells grown in hESF9a2i as described above in Figure 5C were reseeded on a 6-well-plate and cultured for 5 days. The cells stained with anti-OCT3/4 antibody were visualized with Alexa Fluor 488 (upper panels). Nuclei were stained with Hoechst 33342 (blue). Scale bars, 200 µm. Whole cell images in whole plate were captured and OCT3/4 expression profiles were analyzed by Image Analyzer (lower panels). Antigen histogram (red); control histogram (green); Y axis is cell numbers and X axis is fluorescence intensity for anti-OCT3/4 antibody.

