Figure 4.
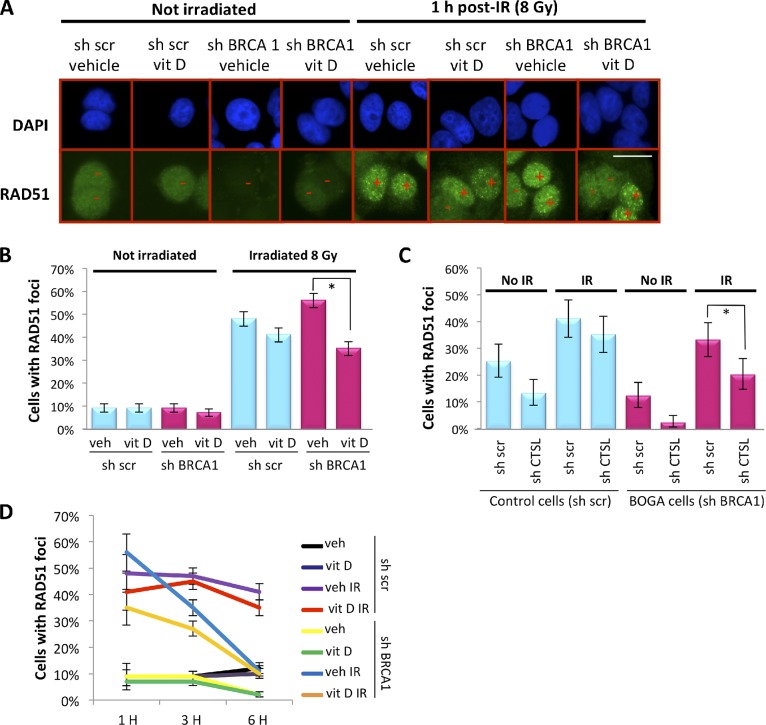
Regulation of RAD51 IRIF in BOGA cells by CTSL and vitamin D. (A) Immunofluorescence to detect RAD51 IRIF after 8 Gy of IR in control and BOGA cells after treatment with vitamin D or vehicle. Plus denotes positive cells (>10 IRIF) and minus negative cells. (B) Graph shows the percentage of cells that form RAD51 IRIF 1 h after IR in the presence of vitamin D or vehicle. Approximately 1,000 cells were analyzed per condition. Error bars were calculated using the exact binomial test. Asterisk shows p-value of statistical significance (*, P ≤ 0.05). (C) Quantitation of RAD51 IRIF in control or BOGA cells proficient or deficient in CTSL showing reduced number of positive cells in CTSL-depleted BOGA cells. At least 200 cells were analyzed per condition. Error bars were calculated using the exact binomial test. Asterisk shows p-value of statistical significance (*, P ≤ 0.05). (D) Quantitation of percentage of cells positive for RAD51 IRIF at different times after IR and upon treatment with vitamin D or vehicle. Note how BOGA cells exhibit defects in RAD51 IRIF 3 and 6 h after IR. Bar, 10 µm.

