Figure 6.
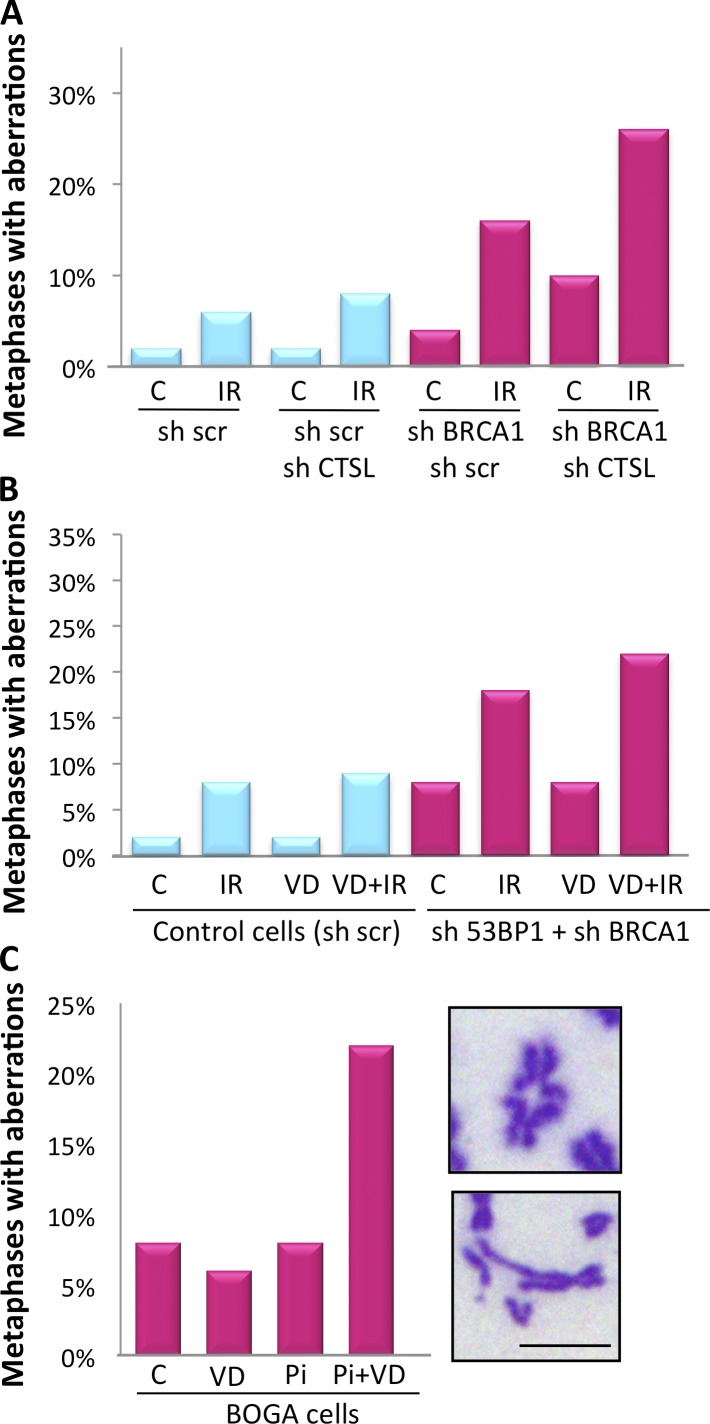
Chromosomal aberrations in response to IR and PARPi. (A) BOGA cells transduced with an shRNA control (sh scr) or an shRNA for CTSL were irradiated with 2 Gy and the percentage of cells with aberrant metaphases was quantified 24 h after IR. A total of 400 metaphases were analyzed in one experiment (50 per condition). (B) MCF7 cells depleted of 53BP1 and BRCA1 (sh53BP1 + shBRCA1) were treated with vitamin D or vehicle 24 h before IR, and the percentage of metaphases with aberrant chromosomes was quantitated. A total of 800 metaphases were analyzed in one experiment (100 per condition). (C) BOGA cells were treated with vitamin D (10−7 M) 24 h before treatment with the PARPi EB-47 (Pi, 1.2 µg/ml) for an additional 48 h. Graph shows the percentage of metaphases with chromosomal aberrations. Images show the types of chromosomal aberrations observed. A total of 400 metaphases were analyzed in one experiment (100 per condition). Bar, 10 µm.

