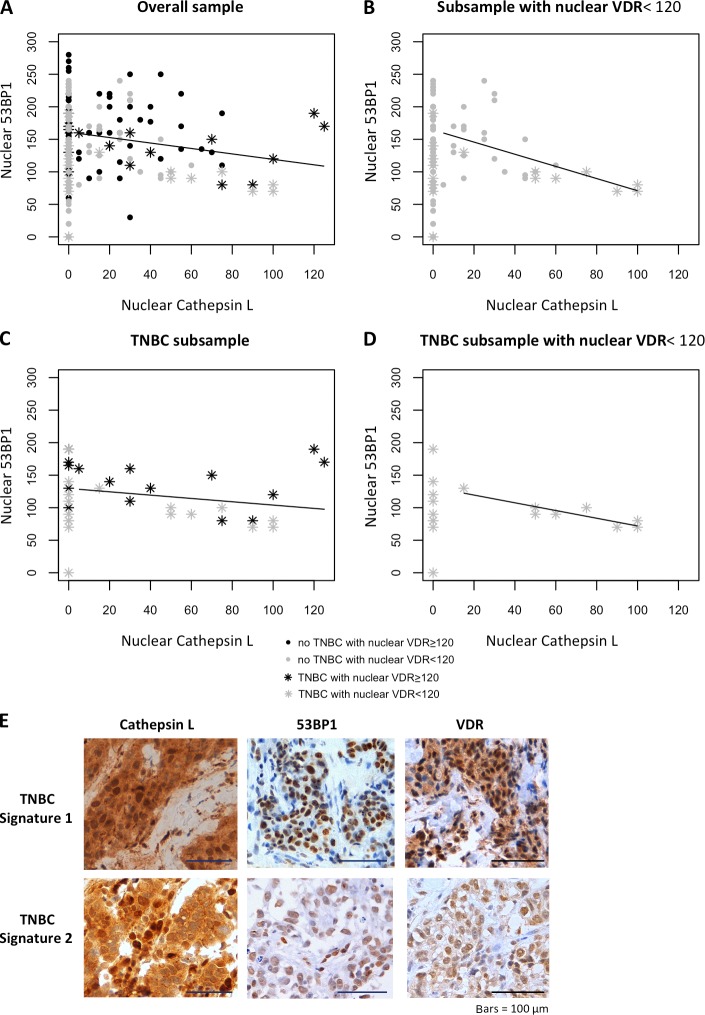
Figure 8.
Nuclear 53BP1 expression correlates inversely with nuclear CTSL expression in sporadic human breast cancer. (A–D) Linear regression analysis between Hscores for nuclear 53BP1 and CTSL in sporadic breast cancer samples with Hscores for nuclear CTSL >0. Note the high variability in nuclear 53BP1 Hscores in tumors without nuclear CTSL. The linear regression analysis of the association between nuclear 53BP1 and CTSL depicted in A (linear regression coefficient r= −0.42; P = 0.02; coefficient of determination r2 = 6.6%) and B (r = −0.93; P = 0.0025; r2 = 29.2%) include Hscores from both TNBC and no TNBC tumors, whereas C (r = −0.255; P = 0.294; r2 = 5.8) and D (r = −0.89; P = 0.0027; r2 = 80.2%) depict TNBC only. Note the marked increase in percentage of the variability in nuclear 53BP1 levels that can be explained by changes in nuclear CTSL parameters of B and D when only tumors with nuclear VDR Hscores <120 are included in the regression analysis. (E) Images of immunohistochemical analysis results in TNBC patients. Two different signatures were observed in these patients (as well as in patients with BRCA1 germline mutations). Top panels show the signature of a few TNBC patients: high nuclear CTSL, 53BP1, and VDR. Bottom panels show the most common signature in TNBC patients: high nuclear CTSL, low 53BP1, and low nuclear VDR. Bars, 100 µm.

