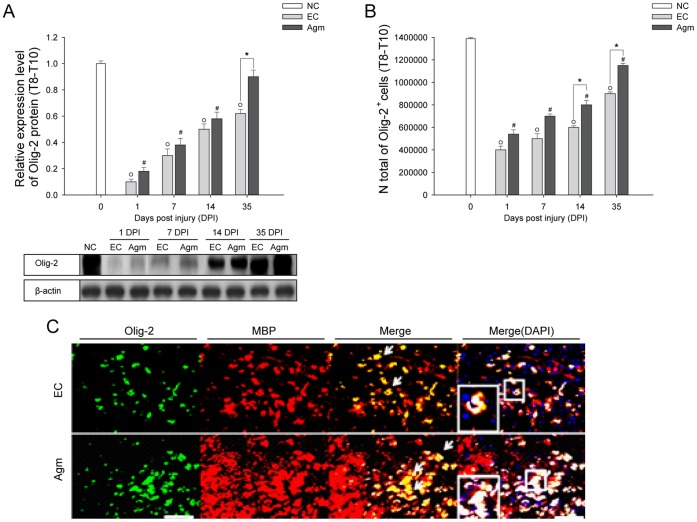
Figure 3. Agmatine treatment increased the expansion of oligodendrocytes following SCI.
(A) Quantification of Olig-2 expression was determined by western blot analysis. The bar graph represents densitometry of the mean Olig-2 expression. Olig-2 expression was significantly higher in the Agm treated group (n = 5) compared with the EC group (n = 5) at 35 DPI. (B) Olig-2+ cell number were acquired using CAST analysis in the Th 8 - Th 10 segments of the injured spinal cord. The number of Olig-2+ cells in the Agm treated group (n = 5) were significantly increased compared to EC group (n = 5) at 14 and 35 DPI. (C) The spinal cords were immunostained with Olig-2 (green) and MBP (red) antibodies at 35 DPI. The number of Olig-2+/MBP+ cells were higher in the Agm treated group (n = 5) than in the EC group (n = 5) around the lesion site at 35 DPI. Higher magnification images revealed intact myelin rings surrounding the axons in Agm treated group, whereas disrupted myelin was found in EC group (see figure in the box). Scale bars: 50 µm. †, p<0.05 NC group vs EC group; #, p<0.05 NC group vs Agm treated group; *, p<0.05 EC group vs Agm treated group. Results represent mean ± S.E.M.

