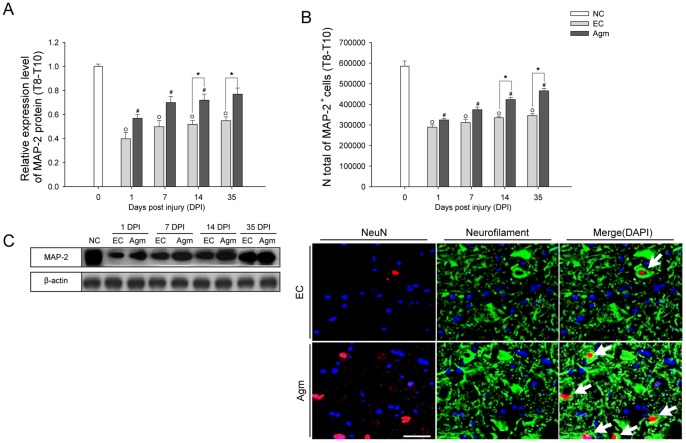
Figure 4. Agmatine treatment prevented neuronal cell loss following SCI.
(A) Western blots of MAP-2 protein expression at 1, 7, 14, and 35 DPI. The representative graphs showed that the MAP-2 expression in Agm treated group (n = 5) was increased from 1 to 35 DPI and the increase was significant at 14 and 35 DPI compared to EC group (n = 5). (B) Stereological count of MAP-2+ cells. The number of MAP-2+ cells were increased in the Agm treated group (n = 5) at 1, 7, 14 and 35 DPI compared with the EC group (n = 5) in Th 8 - Th 10 segments of the spinal cord. (C) The injured spinal cord tissues were immunostained with NeuN (red) and Neurofilament (green). Results showed higher number of NeuN+/Neurofilament+ cells in the Agm treated group (n = 5) compared with the EC group (n = 5) at 35 DPI. Scale bars: 50 µm. †, p<0.05 NC group vs EC group; #, p<0.05 NC group vs Agm treated group; *, p<0.05 EC group vs Agm treated group. Results represent mean ± S.E.M.

