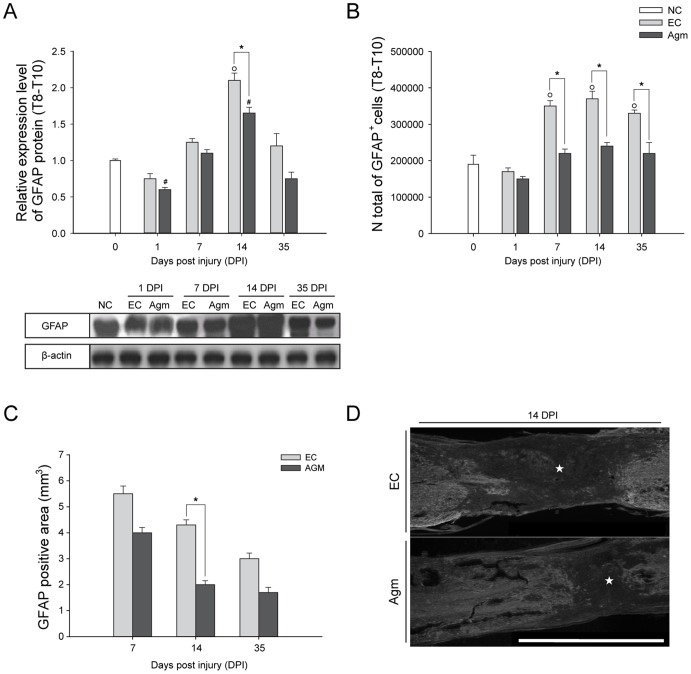
Figure 5. Agmatine treatment reduced the gliosis activation following SCI.
(A) Representative western blots of GFAP expression at each time point in the EC and Agm treated group along with β-actin as a loading control. The GFAP expressions were substantially decreased after SCI in the Agm treated group (n = 5) compared with the EC group (n = 5). (B) The total numbers of GFAP+ cells in the injured spinal cord (Th8– Th10 segments) were counted by CAST analysis. Results showed a significant reduction of GFAP+ cells in the Agm treated group (n = 5) at 7, 14, and 35 DPI compared with the EC group (n = 5). (C) GFAP positive area (glial scar area) was measured at 7, 14, and 35 DPI using an image analysis program. The Agm treated (n = 4) group showed reduction in the glial scar formation area at all the time periods and the reduction was found to be statistically significant at 14 and 35 DPI compared to EC group (n = 4). (D) The EC (n = 4) and Agm treated group (n = 4) were immunostained with GFAP antibody to measure the glial scar area following SCI at 14 DPI. The GFAP positive area was decreased after SCI in the Agm treated group compared with the EC group (★, indicate the glial scar area). Scale bars: 2.0 mm. †, p<0.05 NC group vs EC group; #, p<0.05 NC group vs Agm treated group; *, p<0.05 EC group vs Agm treated group. Results represent mean ± S.E.M.

