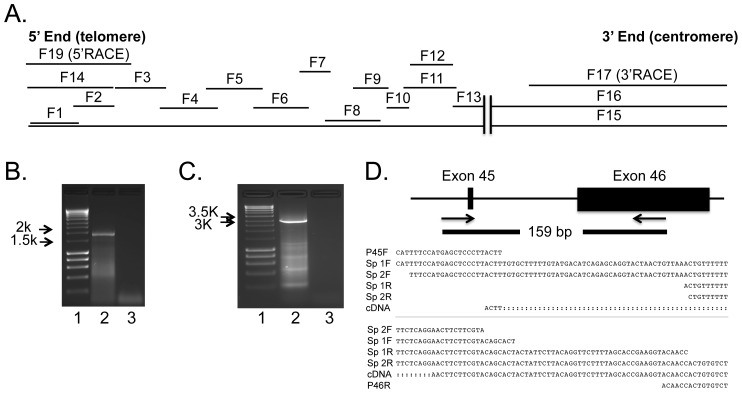
Figure 1. MUC2 cDNA contig.
A. MUC2 cDNA contigs. Sixteen overlapping RT-PCR amplicons and two RACE products are depicted. The double vertical lines represent the cDNA gap in the PTS domain. EST sequences are not shown. B. 5′ RACE. Representative image from 5′ RACE products size fractionated on a 1.2% 1× TAE gel. Molecular weight marker (Lane 1); 5′ RACE produce (Lane 2); Water control (Lane 3). C. 3′ RACE. Representative image from 3′ RACE products size fractionated on a 1.5% 1× TAE gel. Molecular weight marker (Lane 1); 3′ RACE produce (Lane 2); Water control (Lane 3). D. Genomic PCR. We amplified a 159 bp fragment that spanned the gap between exons 45 and 46. Exons are depicted to scale. The forward and reverse sequences from two spleen (Sp 1 and Sp2) samples are shown, along with the cDNA sequence for exons 45 and 46 and the primers. The last 9 bp from the reverse primer are not shown.

