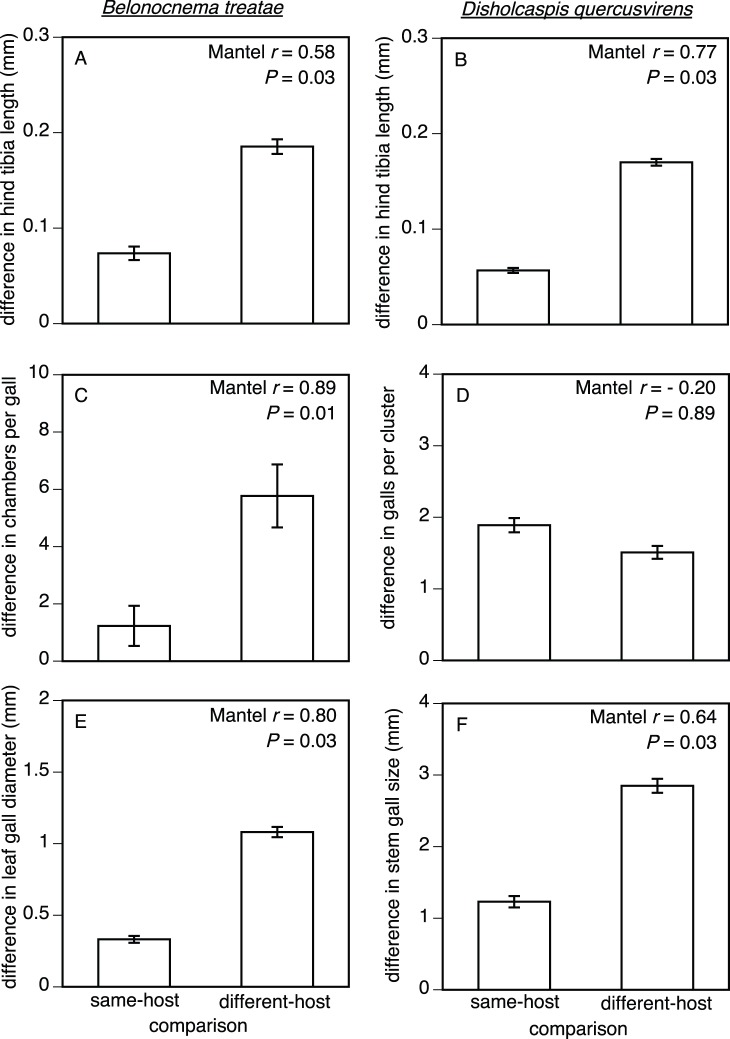
Figure 3. Parallel phenotypic patterns among populations of B. treatae (left) and among populations of D. quercusvirens (right) across the same two host plants, Q. virginiana and Q. geminata.
All values compare mean (± SE) of pairwise differences among populations for each species: (A & B) illustrate body size differences, (C & D) illustrate gall structure differences, and (E & F) illustrate gall size differences. See Tables 2 and 3 for sample sizes per population.

