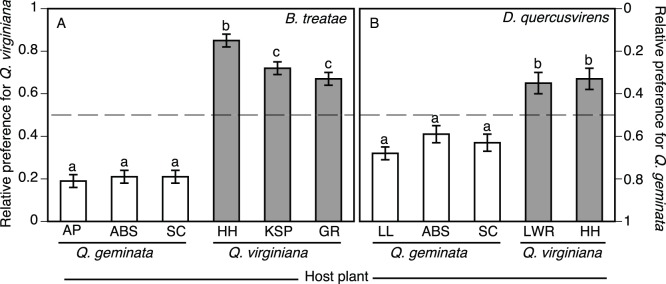
Figure 4. Parallel behavioral patterns in host preference among (A) B. treatae and (B) D. quercusvirens populations associated with Q. virginiana or Q. geminata.

Mean (± SE) illustrates the proportion of time spent on Q. virginiana by each population; however, note reversed y-axis on right (mean time on Q. geminata = 1– mean time on Q. virginiana). The dashed line highlights no preference (defined as 50% of time spent on each host). Each population differs significantly from 50% (P<0.001). See Tables 2 and 3 for locality information and sample sizes per population. Letters above bars denote significant differences among means from Tukey’s HSD test (P<0.05).
