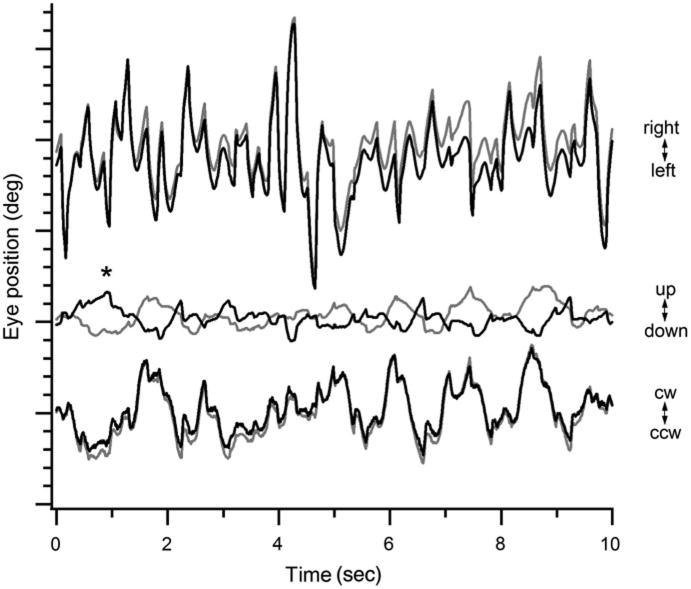
Fig. 1.
See-saw nystagmus in achiasma as demonstrated by 60-Hz infrared oculography. The horizontal (top), vertical (middle), and torsional (bottom) dimensions of eye movement over 10 seconds are displayed, with each major tick on the y-axis representing 10 and each minor tick representing 2. At the * there was intorsion and elevation of the right eye (black traces) and extorsion and depression of the left eye (gray traces), findings consistent with see-saw nystagmus. This was immediately followed by extorsion and depression of the right eye and intorsion and elevation of the left eye. CW, clockwise; CCW, counterclockwise.

