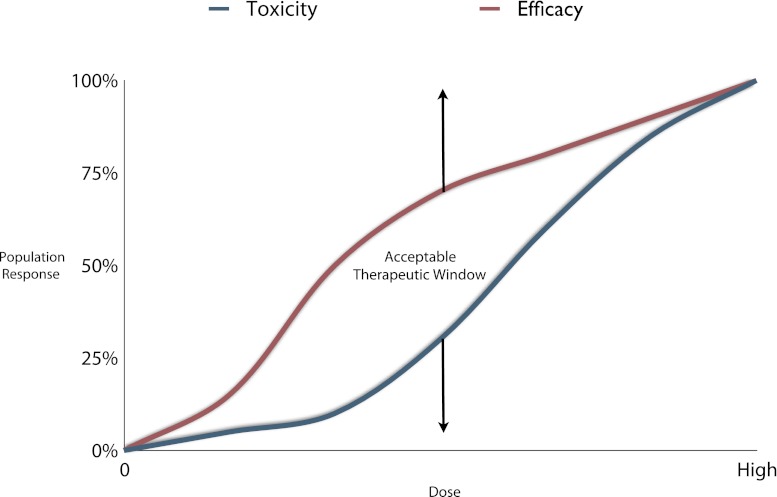
Fig. 2.
Population response versus toxicity: The area between the curves represents the therapeutic range in which efficacy is outweighed by the toxicity. At higher doses, the efficacy and toxicity lines begin to converge making the risk of toxicity not worth the increased efficacy. BSPs may allow exclusion of patients at risk of toxicity and allow for increased doses in drug-resistant patients. This can increase the area between these lines thereby increasing efficacy and decreasing toxicity for a specific drug

