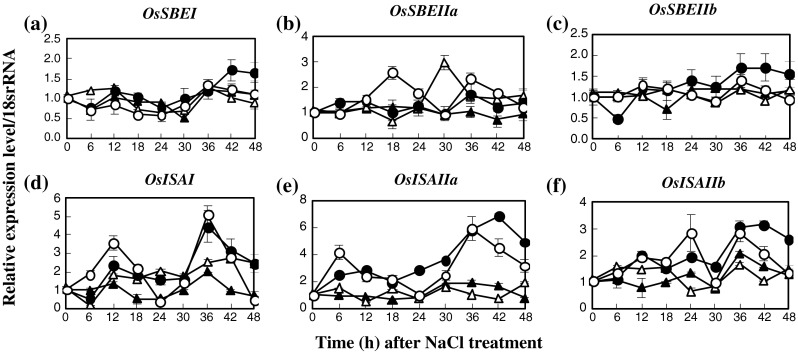
Fig. 3.

Expression patterns of SBE (a–c) and SDE (d–f) in leaf tissues of IR29 (circle) and Pokkali (triangle) seedlings grown under 0 (opened symbol) or 200 mM NaCl treatment (closed symbol) for 48 h

Expression patterns of SBE (a–c) and SDE (d–f) in leaf tissues of IR29 (circle) and Pokkali (triangle) seedlings grown under 0 (opened symbol) or 200 mM NaCl treatment (closed symbol) for 48 h