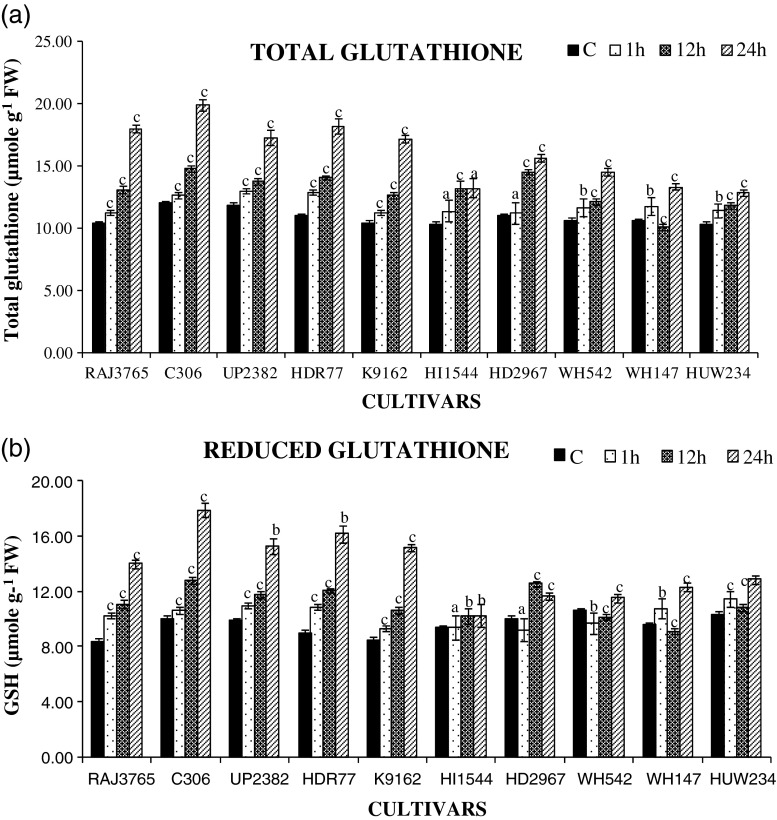
Fig. 7.
Estimation of glutathione content. a changes in total glutathione content b reduced glutathione (GSH) content in highly tolerant and sensitive cultivars of wheat exposed to 0, 1, 12 and 24 h of dehydration stress treatment. Data represent the means ± SD of three independent experiments (n = 3), a P < 0.05, b P < 0.01, c P < 0.001

