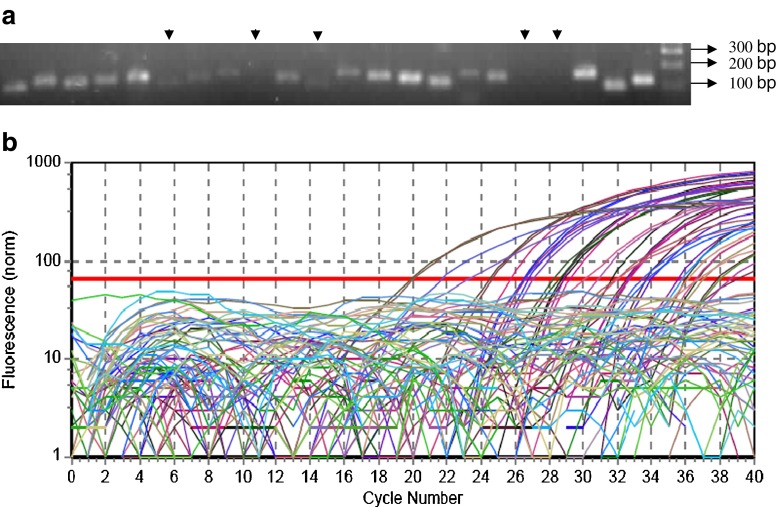
Fig. 2.
Specificity of qRT-PCR reaction. a Separation of qRT-PCR products of 22 genes on 3 % agarose gel gives single product of the expected size for most of the reactions with few reactions yielding no product (arrow). b Typical real-time PCR amplification plot of 22 genes for two types of cDNA samples of shoot and root tissues of sorghum. As number of PCR cycle increases there is increase in fluorescence. Some curves do not cross threshold line in such reactions there is no detectable PCR product when loaded on 3 % agrose gel

