
Fig. 3.
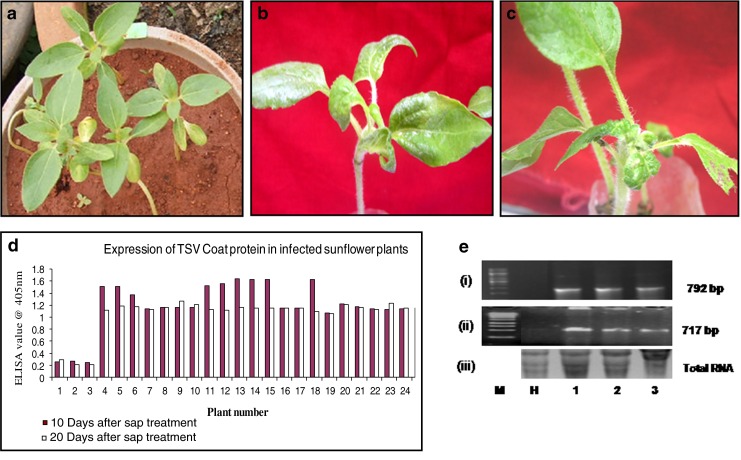
a–c: Response of the sap inoculated seedlings to TSV 20 days after inoculation. a: absolute control; b & c: sap inoculated seedlings with SND symptoms. d: Expression analysis by ELISA for coat protein 10 days and 20 days after sap inoculation in the inoculated and uninoculated (absolute control) seedlings. Bars 1–3: absolute control; Bars 4–25: sap inoculated seedlings showing SND symptoms. e: RT-PCR analysis. (i) RT-PCR analysis using movement protein gene specific primers (ii) RT-PCR analysis using coat protein gene specific primers; (iii) Total RNA as loading control. Lane M: marker; Lane H: healthy absolute control; Lanes 1–3: amplified products from sap inoculated seedlings