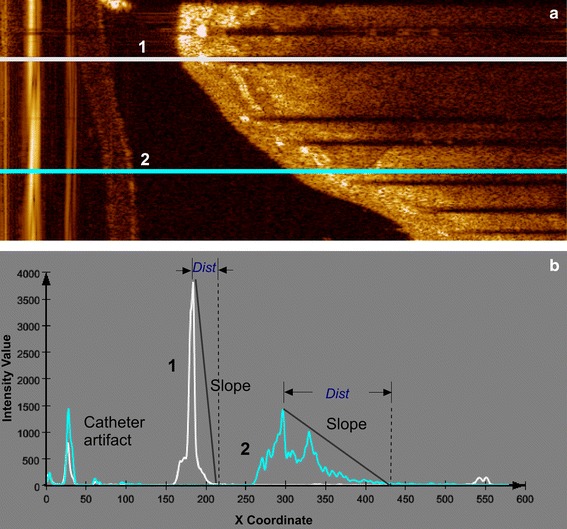
Fig. 3.

Examples of intensity profiles in polar images. The A-line (1) in a crosses a stent strut and its corresponding intensity profile in b has a higher peak point and a sharp fall to the shadow area, compared to the A-line (2) in a, which passes purely through tissue and its corresponding intensity profile in b has a longer distance between the peak point and the shadow area. “Dist” indicates the distance between the peak point and the start point of the trailing shadow
