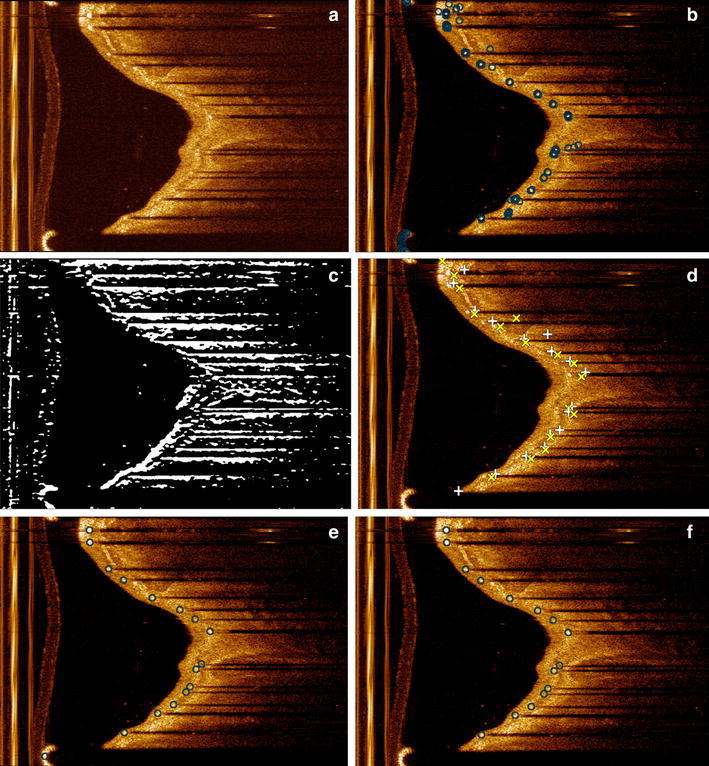
Fig. 4.

Results of each step in the shadow edge detection. a shows the original image. b Shows the results of the candidate pixel detection including false positives. Peak points are indicated as ‘circle’. c shows the result after Prewitt compass edge detection for only bottom edges. In d, the top edges are indicated by ‘plus sign’ and the bottom edges by ‘times symbol’. e Shows the clustering results which are indicated by ‘circle’. In f the final results after guide wire removal are presented with the struts indicated by ‘circle’
