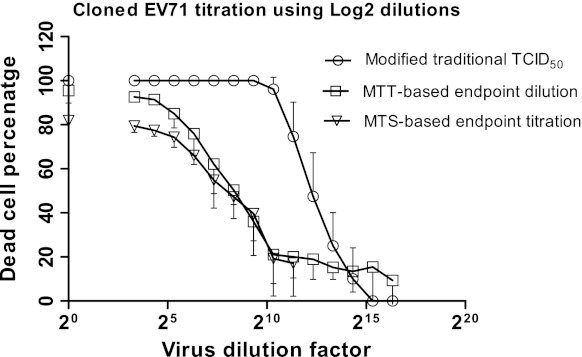
Fig. 2.
Depiction of the titer of the cloned EV71 virus using three methods based on log2 virus dilution. The dead cell percentages are plotted against virus dilutions on a log2 scale. The dilution factor 20 represents undiluted virus control, which was assumed to display 100 % cell death in the modified traditional TCID50 but was quantifiably calculated using MTT or MTS in the other methods. The values represent mean ± SD generated from three independent experiments

