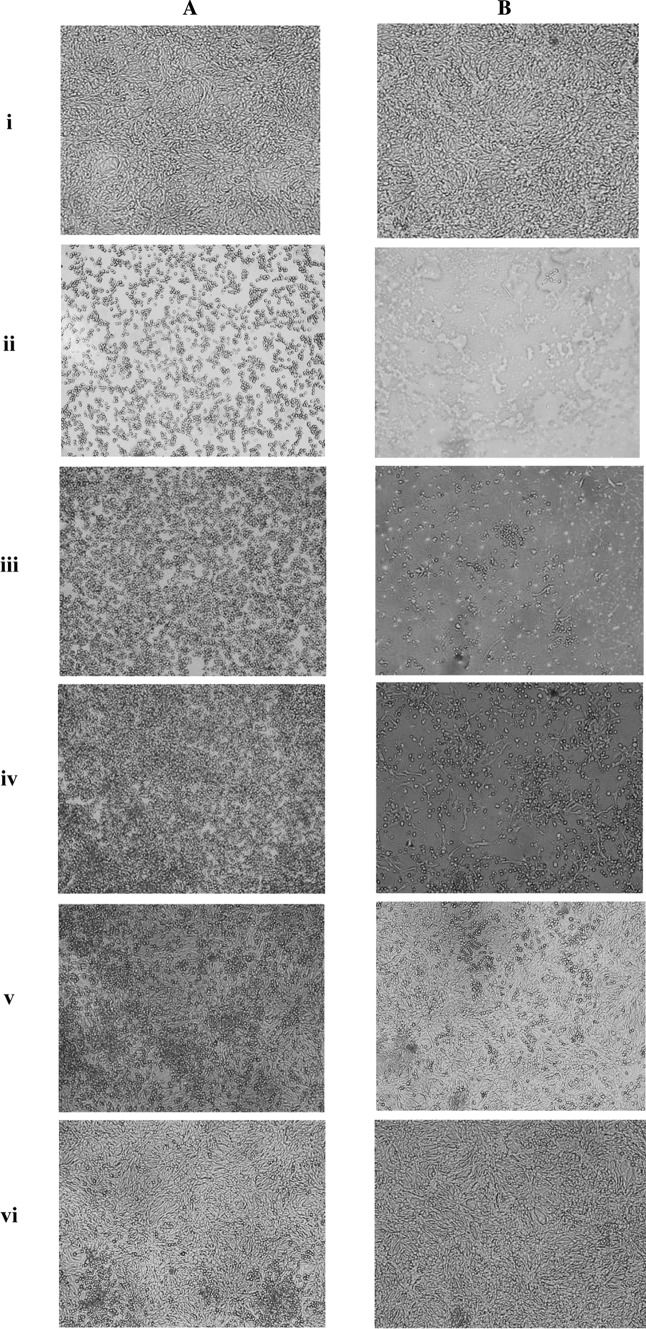
Fig. 4.
Micrographs displaying the Vero cell monolayer at a MTT-based TCID50 assay. The photos in Panel A, show the wells before removing supernatant, while the photos in Panel B show the same wells after removing supernatant and washing with PBS. i Mock-infected control, ii undiluted virus control (1:1), iii viral dilution 1:101, iv viral dilution 1:10 × 23, v viral dilution 1:10 × 27, vi viral dilution 1:10 × 29. The photos are taken 72 h post infection using inverted microscope (×100 magnification, Olympus, CKX 41, Japan)

