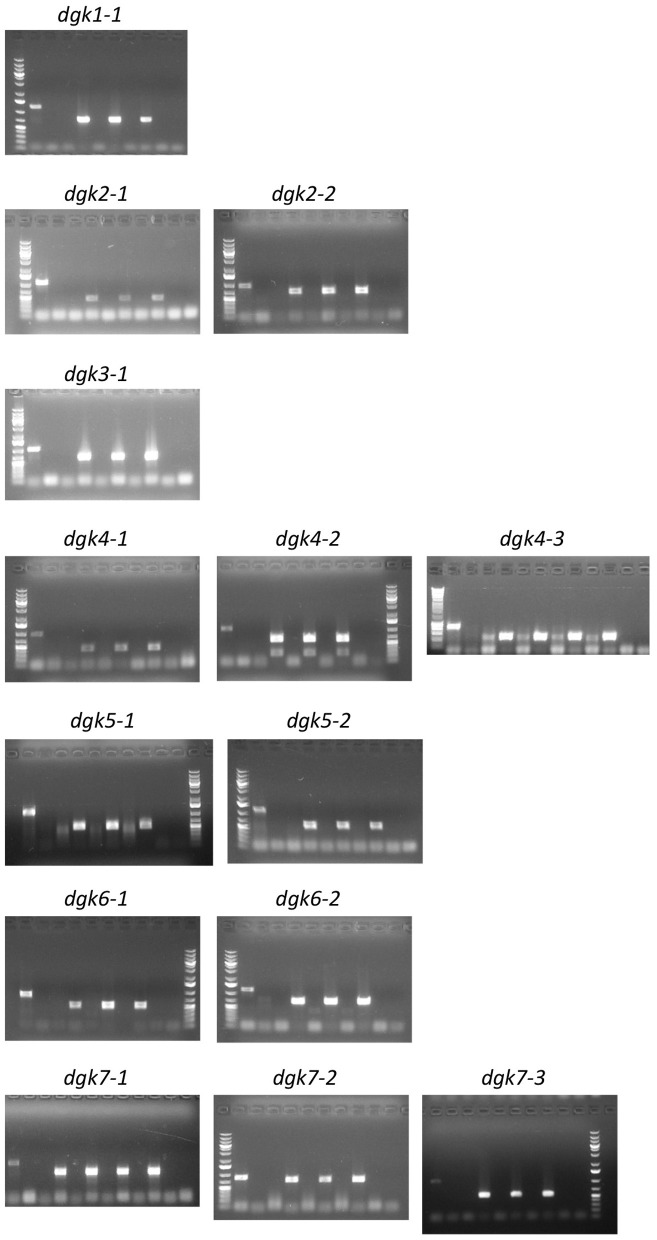
Figure A3.
Genotyping of the Arabidopsis dgk T-DNA insertion lines. DNA was isolated from leaf discs from 3 to 4 independent plants and zygosity determined by PCR using specific wt- and mutant-primer sets as listed in Table A1. Gel sample order (from left to right): Size marker; Col-0 (wt), with first primer set, LP/RP (= wt band) and second primer set, RP/LB (= insertion band); Three (or four) independent dgk plants, with first primer set, LP/RP (= wt band) and second primer set RP/LB (= insertion band); Last lane, primer control (−). Some gels end with the size marker. Results clearly show that all lines used are homozygous T-DNA insertion lines since Col-0 was the only line giving wt bands and all insertion lines gave only bands with the second primer set. For the SALK lines LBb1.3 was used as LB primer, for the SAIL lines LB3 was used as LB primer (see primer list, Table A1).

