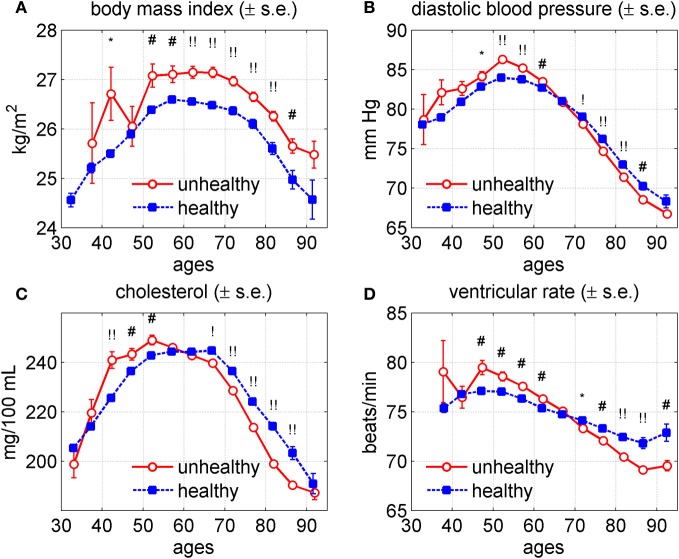
Figure 5.
Average trajectories (±standard errors) of four physiological variables for “unhealthy” and “healthy” individuals in the Framingham Heart Study (original cohort, pooled data from exams 1–28). (A) Body mass index; (B) diastolic blood pressure; (C) cholesterol; (D) ventricular rate. Note: “unhealthy” individuals are those with cancer, CVD or diabetes; “healthy” are those free of these three diseases. Measurements of physiological indices before the onset of any of these diseases contribute to the “healthy” trajectory and those after the onset of any of the diseases contribute to the “unhealthy” trajectory. Symbols above the curves correspond to p-values for testing the null hypotheses on equality of means in respective age groups: no symbol: p ≥ 0.05; *: 0.01 ≤ p < 0.05; #: 0.001 ≤ p < 0.01; !: 0.0001 ≤ p < 0.001; !!: p < 0.0001.

