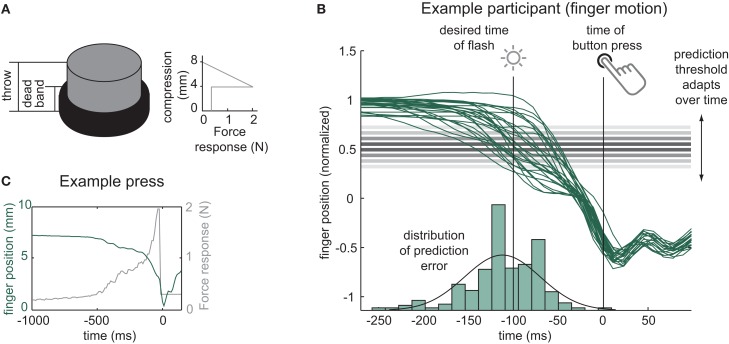
Figure 2.
The virtual button and prediction method. (A) Force-response of the virtual button. (B) Example finger movement trajectories in the vertical dimension (green solid lines; 1 unit~4 mm, normalized for initial finger height, cf. main text) and prediction error over 333 trials (green histogram at the bottom) for a l = −100 ms (vision-lead) stimulus in an example participant. The adaptive threshold moves up and down according to the sign of the error on a previous trial. (C) Example button press (green) and force-response (grey) across time.

