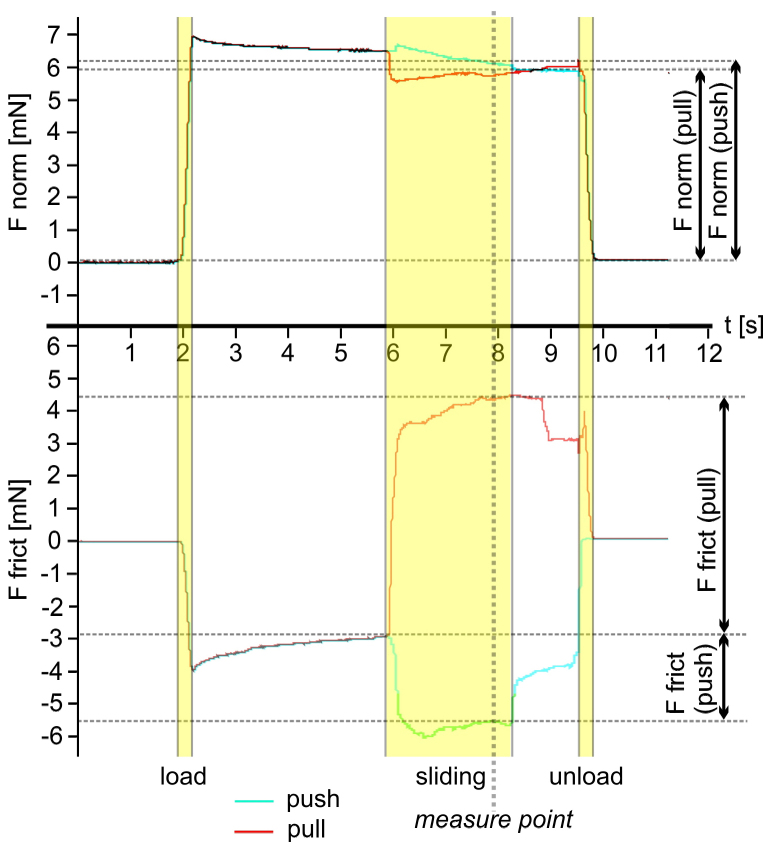
Figure 2. Time-force curves of a typical experimental run for the pulling (red line) and the pushing (blue line) case.
Normal forces (graph above) and friction forces (graph below) were recorded simultaneously. Values were obtained from forces recorded after two seconds after shear movement was started (measure point), to ensure that the contact between the pad and substrate was formed and friction forces have reached plateau. Friction coefficient μ was calculated as the quotient between friction and normal force.

