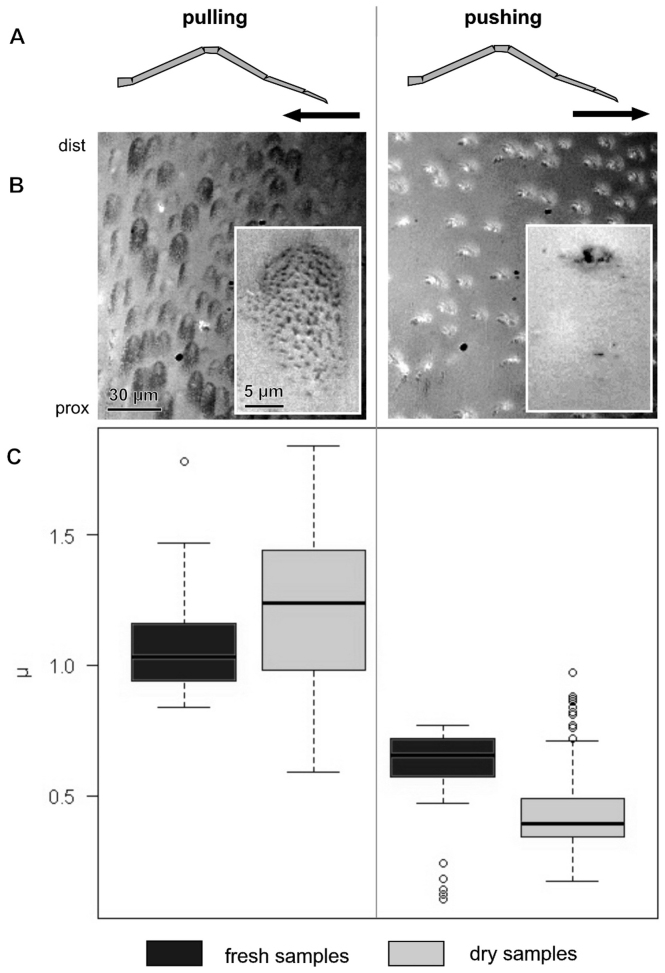
Figure 3. Comparison of friction coefficients μ of sheared claw tufts between pulled and pushed conditions of the leg in fresh and air dried samples.
Columns show data from shear direction as labelled above. (A) Schematic illustration of the lateral view of the leg with an indication of shear direction. (B) RICM images of the distal part of the L4 claw tuft under the corresponding shear movement, indicating the difference in contact area (insets show single seta in contact). (C) Boxplot of friction coefficient (μ) data, illustrating median, interquartile range and extreme values.

