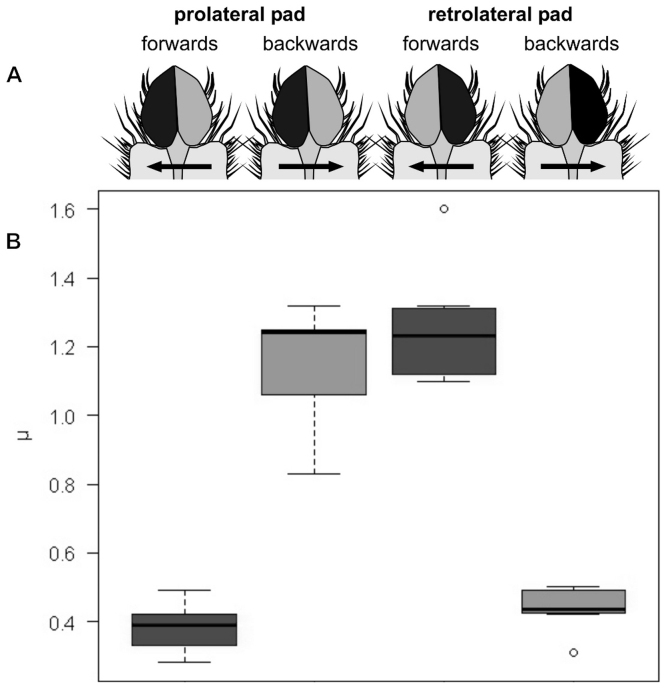
Figure 5. Comparison of friction coefficients μ of laterally sheared individual lobes of bilobed claw tufts.
(A) Schematic illustration of the direction of shearing of corresponding lobes, ventral view. Black areas mark the contacting lobe. Arrows indicate simulated slide direction of the tarsus. (B) Boxplot of friction coefficient data, illustrating median, interquartile range and extreme values.

