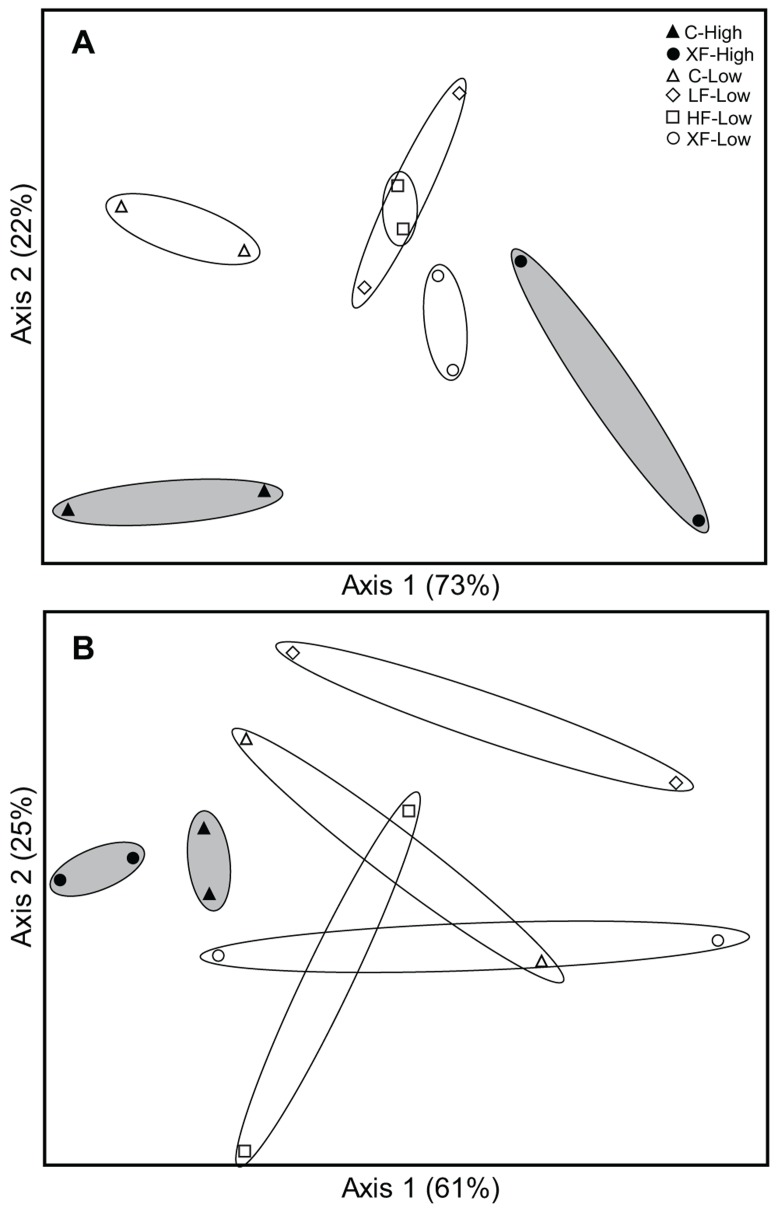
FIGURE 2.
Non-metric multidimensional scaling ordinations based on TRFLP profiles for betaproteobacterial amoA genes (A) and archaeal amoA genes (B). Low marsh samples are represented by open symbols; high marsh samples are represented by filled symbols. Polygons (white-filled for low marsh, gray-filled for high marsh) are drawn around replicate samples in each plot. The percent variability explained by each axis is indicated parenthetically.

