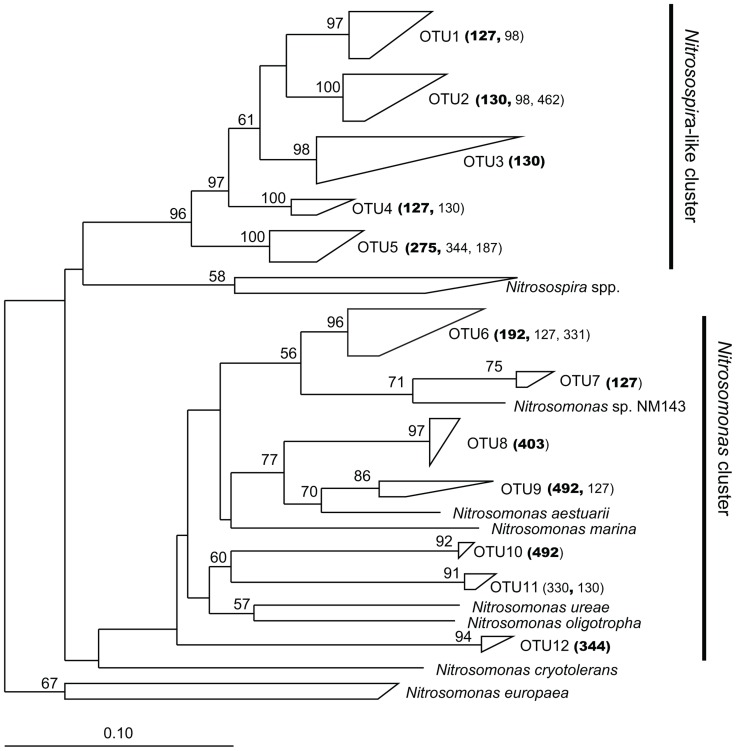
FIGURE 3.
Phylogenetic relationships among betaproteobacterial amoA nucleotide sequences recovered from plots in the Great Sippewissett Marsh. The tree was inferred from 466 nucleotides using the neighbor-joining algorithm with the Kimura two-parameter correction. Bootstrap values >50% are shown at the internal nodes. Each polygon represents sequences from a single OTU with the TRF sizes of the sequences (number of base pairs determined in silico) indicated parenthetically. TRF sizes representing ≥85% of the sequences in the cluster are shown in bold.

