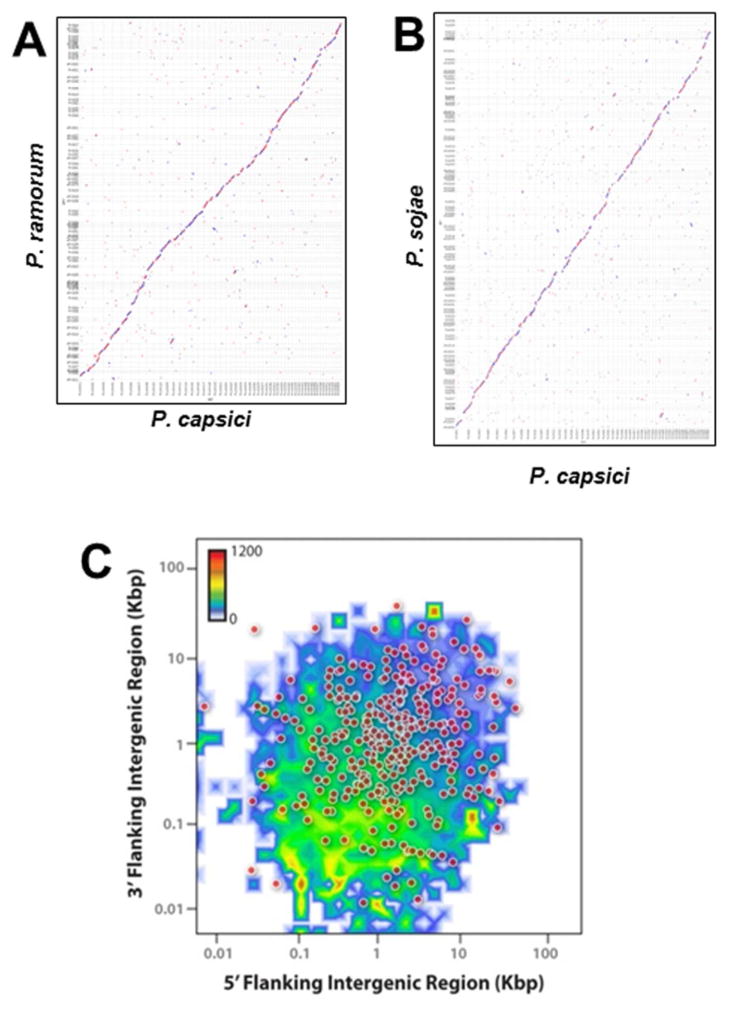
Figure 2. Synteny and genome architecture of P. capsici.
Pairwise comparison of gene models from P. capsici to P. ramorum (A) and P. sojae (B). Sequences other than gene models were replaced with Ns. Maximal unique matches in all 6 frames were used as anchors for amino-acid-based alignment with the PROmer package of MUMmer. Scaffolds >450 kbp are shown (P. capsici: 46 Mb, P. ramorum: 36 Mb, P. sojae: 58 Mb). Scaffolds were ordered to maximize the center diagonal. There were some translocations, which possibly were assembly errors. A small region of P. sojae (top) had no syntenic genes in P. capsici. (C) P. capsici whole genome architecture illustrated by the distribution of all predicted genes according to the length of their 5′ (X-axis) and 3′ (Y-axis) intergenic regions, counted by two-dimensional binning. The color scale shows number of genes in bins. In addition, the 365 predicted proteins for which no homolog was found (10e-5 e-value cutoff) are indicated as dots.

