Fig. 1.
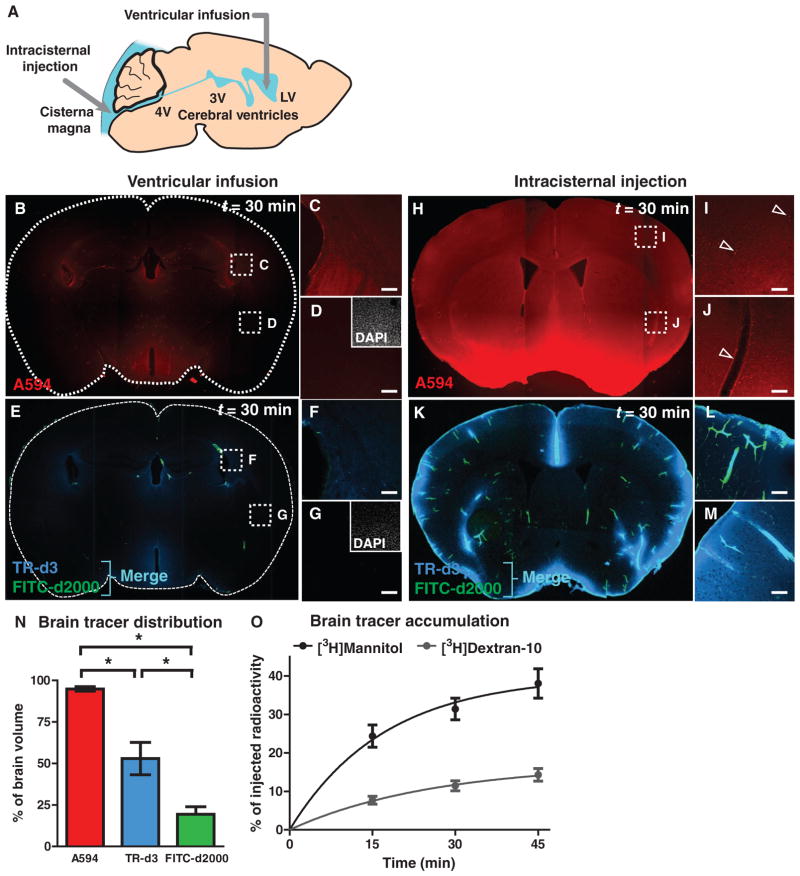
Distribution of subarachnoid CSF into the brain parenchyma. (A) The movement of ventricular and subarachnoid CSF into the brain parenchyma was evaluated after infusion of fluorescent tracer into the lateral ventricle (LV) or cisterna magna. (B to G) After 30 min of intraventricular infusion, small– (A594; molecular size, 759 daltons; red), moderate– (TR-d3; molecular size, 3 kD; blue), and large–molecular weight (FITC-d2000; molecular size, 2000 kD; green) tracer movement into the brain parenchyma was evaluated. 3V, third ventricle; 4V, fourth ventricle. (D and G) Absence of tracer in tissue remote from the periventricular space. Insets, 4′,6-diamidino-2-phenylindole (DAPI) labeling in the same fields of view. (H to J) Small–molecular weight tracer permeation 30 min after intracisternal injection. Arrowheads, low-level paravascular accumulation. (K to M) Distribution of intracisternally injected TR-d3 (dark blue) and FITC-d2000 (green). Merge (light blue) indicates colocalization of TR-d3 and FITC-d2000. (N) Distributions of intracisternal fluorescent tracers, quantified as a percentage of total brain volume (integrated slice areas). A594 occupied the greatest proportion of brain tissue. TR-d3 exhibited an intermediate distribution, whereas FITC-d2000 was highly restricted (n = 3, *P < 0.05). (O) Accumulation of radiotracer within the brain after intracisternal injection of [3H]mannitol (molecular size, 182 daltons) or [3H]dextran-10 (molecular size, 10 kD). Compared to [3H]mannitol, [3H]dextran-10 accumulation in the brain was significantly slower (n = 6 per time point, *P < 0.0001). Scale bars, 100 μm.

