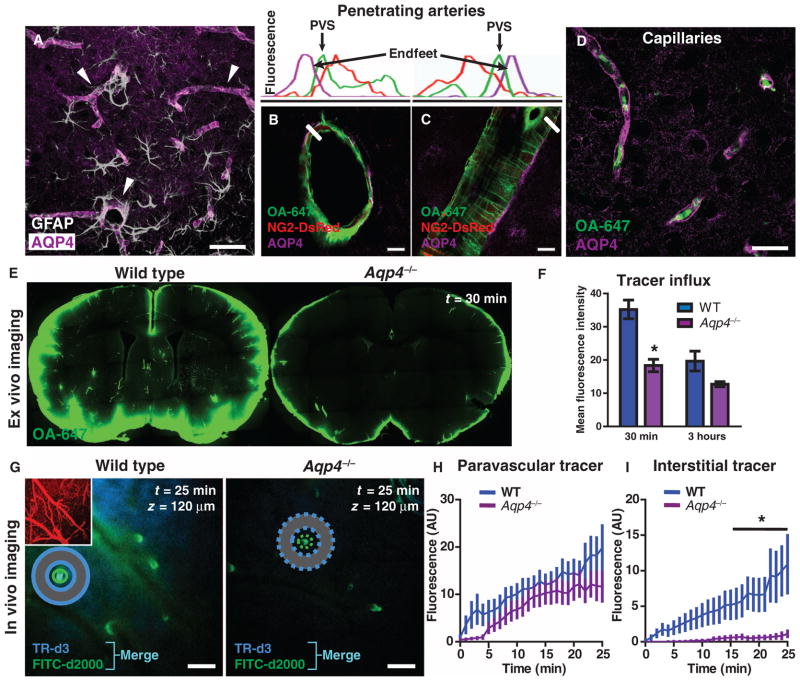
Fig. 4.
Paravascular AQP4 facilitates CSF flux through the brain interstitium. (A) AQP4 (purple) is specifically expressed in brain astrocytes (white), where localization is highly polarized to perivascular endfeet (arrowheads). (B and C) AQP4-positive perivascular astrocytic endfeet immediately surround the para-arterial CSF influx pathway. Plots depict fluorescence intensity projections from (B) and (C), indicated by white rectangles. Tracer (green) is localized within the paravascular space (PVS), between the vascular smooth muscle (red) and the astrocytic endfeet (purple). (D) Tracer movement along the capillary basal lamina (green) is bounded by perivascular AQP4-positive endfeet (purple). (E and F) The contribution of AQP4-mediated fluid flux to the movement of subarachnoid CSF into and through the brain parenchyma was evaluated ex vivo. When tracer labeling was quantified, the movement of intracisternally injected tracer into the brain was significantly reduced in Aqp4-null mice compared to wild-type (WT) controls 30 min after injection (n = 4 to 5 per time point, *P < 0.05). (G) The influx of small– (TR-d3) (dark blue) and large–molecular weight (FITC-d2000) (green) intracisternal tracers into the cortex was evaluated in vivo. The cerebral vasculature was visualized with intra-arterial CB-d10 (inset). Merge (light blue) indicates colocalization of TR-d3 and FITC-d2000. (H) The movement of large–molecular weight tracer (green) along para-arterial spaces [as measured by the mean fluorescence intensity in green circle region of interests (ROIs)] was not significantly altered in Aqp4-null versus WT control animals. (I) The movement of small–molecular weight tracer into the interstitium surrounding penetrating arterioles (as measured by the mean fluorescence intensity in the blue donut ROIs) was abolished in Aqp4-null compared to WT controls (n = 6 per group, *P < 0.01), demonstrating that Aqp4 gene deletion affects the movement of intracisternally injected tracer through the cortical parenchyma. AU, arbitrary units. Scale bars, 100 μm (G), 40 μm (A), 20 μm (D), and 10 μm [(B) and (C)].

