Fig. 3.
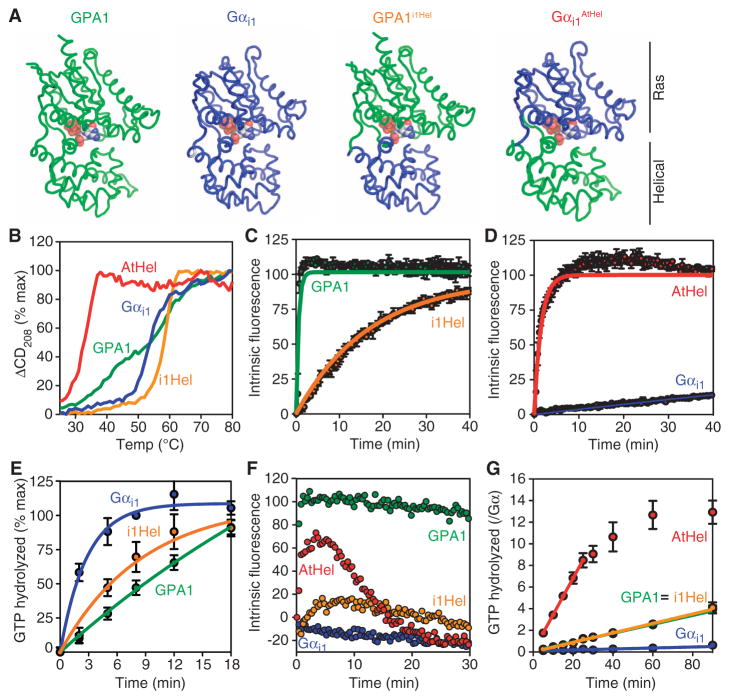
Kinetics and unfolding properties of G protein α subunit chimeras. (A) Cartoon representations of the chimeras used in this study. (B) Temperature-induced unfolding of the indicated G protein α subunits as monitored by CD spectroscopy at 208 nm. (C and D) GTP-γ-S binding rates were measured from intrinsic fluorescence changes as described in Fig. 1 with GTP-γ-S (2 μM). (E) Single-turnover GTP hydrolysis. Purified His-tagged G protein α subunits (900 nM) were loaded with [γ-32P]GTP before the reaction was started by addition of Mg2+. Hydrolyzed 32PO4 was extracted with charcoal and quantified. (F) Fluorescence-based GTP binding and hydrolysis were measured as described in Fig. 1 with GTP (400 nM). (G) Steady-state GTP hydrolysis. Purified G protein α subunits (400 nM) were incubated with [γ-32P]GTP (10 μM) for the indicated times before hydrolyzed 32PO4 was extracted with charcoal and quantified. For all of the panels, data are representative of at least two experiments. Error bars indicate SEM.

