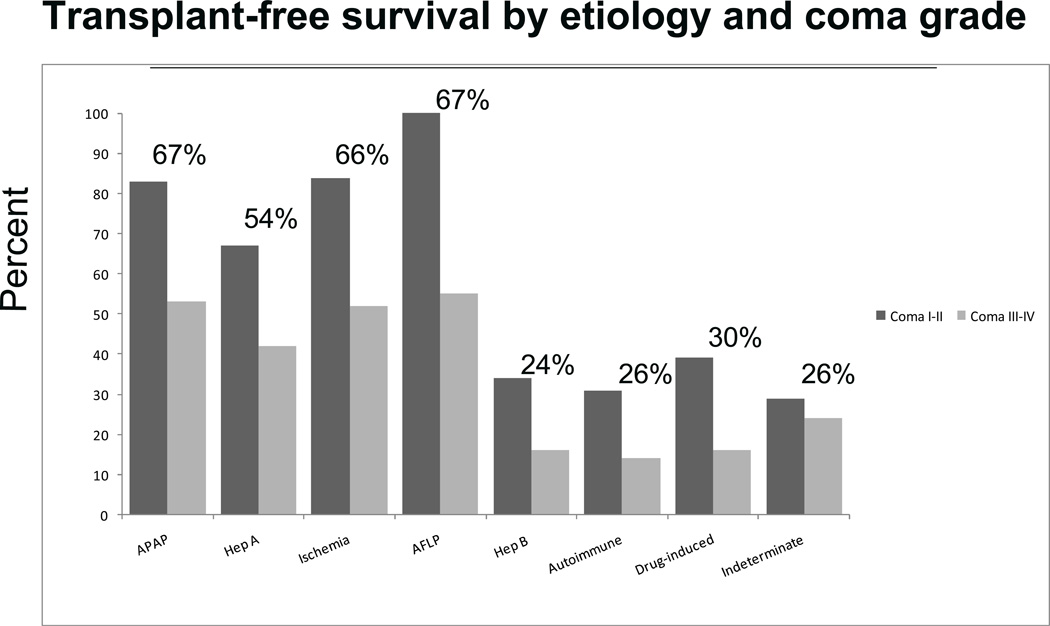
Figure 4.
Outcomes according to etiology and coma grade. The bars for each etiology indicate the percent survival without transplantation according to coma grade (I,II vs. III,IV). The percent above each pair indicates the overall percentage of spontaneous survival for that etiology. There is a disparity between the etiologies with good survival and those with poor survival but much poorer in all categories if patient is admitted with an advanced coma grade.

