
Fig. 5.
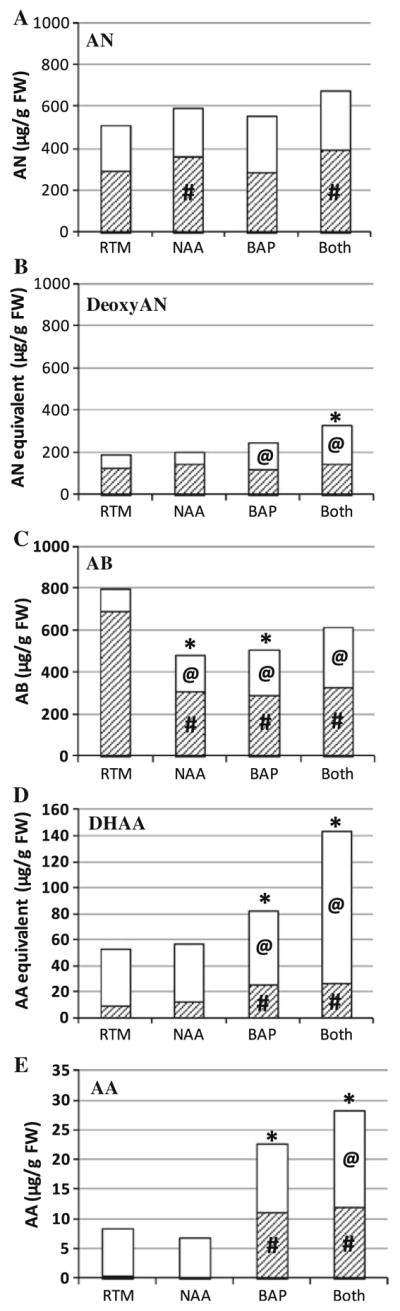
Metabolite levels of rooted shoots after growing in RTM with NAA ± BAP when compared to correlating leaves in RTM controls. End products: a AN, b deoxyAN, c AB; precursors: d DHAA, e AA. Shaded mature leaves, white young leaves, n ≥ 7. For comparison to mature leaves in RTM #p ≤ 0.05, for comparison to young leaves in RTM @p ≤ 0.05, for comparison to entire plant in RTM *p ≤ 0.05. RTM rooting medium; NAA, RTM + 0.25 μM NAA; BAP, RTM + 2.5 μM BAP; Both, RTM + 0.25 μM NAA + 2.5 μM BAP