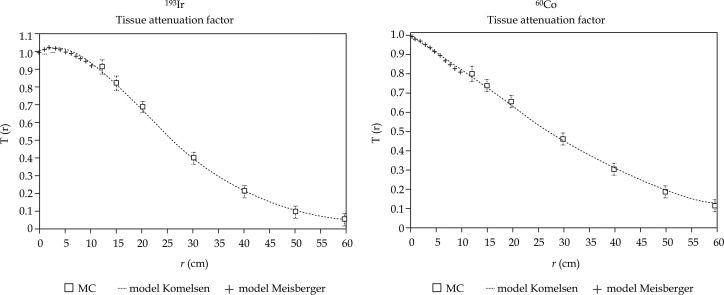
Fig. 9.
Results of the Monte Carlo calculations for the 192Ir and 60Co isotope in the range of 10 < r ≤ 60 cm. In the range of 0 ≤ r ≤ 10 cm, results are presented from the model of Meisberger. The lines represent a fit through the Meisberger and the Monte Carlo data points, according to the model of Kornelsen [19]

